Periodic Table of Investment Returns​

Callan Institute logo

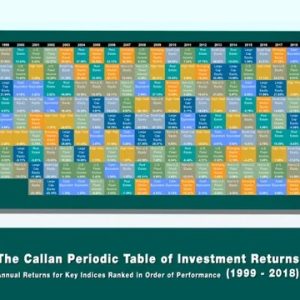
The Callan Periodic Table of Investment Returns graphically depicts annual returns for various asset classes, ranked from best to worst. Created by Jay Kloepfer in 1999, the table features well-known, industry-standard market indices as proxies for each asset class.


“The enduring appeal of the table is its ability to be understood at a glance,” says Kloepfer. “And once you’ve seen and absorbed it, you can refer to it again and again. New insights still come to me even 20 years later!”


Below, explore our classic, annual Periodic Table, as well as our monthly edition and collection of rankings for assorted indices and strategies.

The Periodic Table of Investment Returns depicts annual returns for 9 asset classes, ranked from best to worst performance for each calendar year.

Callan Periodic Table Collection | Year-End 2023

Expanding upon our Classic Periodic Table, the Collection features 12 additional versions including tables related to inflation, real estate, and hedge fund sub-strategies.

This edition of Callan’s Periodic Table offerings shows monthly rankings of key indices through December 2024.

Explaining Callan's Periodic Table

Celebrating its 20th anniversary in 2019, the Callan Periodic Table of Investment Returns is more popular than ever. Go back in history in this animated feature to meet the table’s mastermind and learn how it can help investors of all kinds.

Have questions about Callan's research?