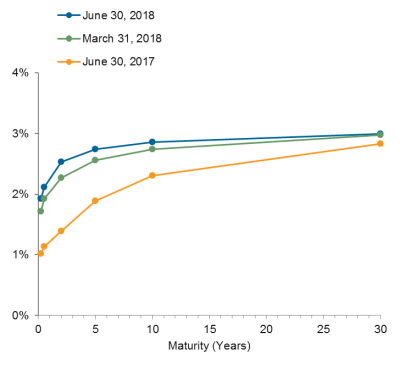
The U.S. Treasury yield curve has been on a “flattening” trend since the end of 2013. At the end of 2013, the difference between the 2-year and 10-year U.S. Treasury note yield was 260 basis points; today it is roughly 30 bps. The last time the spread was this low was in August 2007, just before the Global Financial Crisis.
The relatively flat curve is a result of rising short-term rates with relatively stable longer-term yields. The Fed has hiked the Fed Funds rate from 0% (12/16/2008) to the 1.75% – 2.0% target today. Longer-term yields have not followed. This is somewhat counterintuitive given the strength of the U.S. economy. Normally, yield curves are upward sloping when economic growth is strong, because investors generally need to be compensated for investing in longer-maturity bonds in a growing economy and thus demand higher yields.
U.S. Treasury Yield Curve

If the Fed continues to raise rates as expected—two more times this year and three next year—and long-term yields do not rise commensurately, the curve will “invert,” meaning short-term yields are higher than long-term yields. That said, the yield curve could avoid an inversion if the Fed does not raise interest rates as much as expected, or if longer-term yields gradually increase as short-term rates rise.
What’s the big deal? Historically, an inverted curve has signaled that a recession is coming. As researchers at the San Francisco Fed recently noted, “Curve inversions have correctly signaled all nine recessions since 1955 and had only one false positive, in the mid-1960s, when an inversion was followed by an economic slowdown but not an official recession.” However, the timing of the yield curve’s “predictive” power has been variable. Recessions following an inverted curve have occurred over a wide range of 6 to 24 months out.
The logic behind this phenomena is that relatively high short interest rates, which are controlled by the Fed, cause spending and investment to slow and thus cause the economy to slow. Long-term yields are a function of market forces—supply and demand. Traditionally, falling or lower yields have reflected investors’ expectations that growth and/or inflation will slow.
Some economists have argued, however, that “this time is different.” A variety of alternative explanations have arisen for the flat curve, largely around exogenous factors that have affected demand for long-term U.S. Treasuries, keeping yields relatively low. These include:
- Heightened demand for longer-maturity U.S. Treasuries from overseas investors given the yield differential between the U.S. and other developed markets
- Strong demand for long-term U.S. Treasuries from U.S. pension plans and insurance companies seeking to match their liabilities
- Continued, if reduced, asset purchases by the Fed, focused on the long end of the yield curve
- Muted inflation expectations (a myriad of hypotheses on this topic)
- Demand for safe haven securities in the face of geopolitical uncertainty and trade wars
These arguments suggest that technical factors are behind the shape of the yield curve rather than worries over an economic slowdown. We tend to agree with this sentiment—but only time will tell whether “this time is different!”


