With target date funds (TDFs) now accounting for nearly 30% of the average defined contribution plan’s assets, understanding their performance, fees, and asset allocations is more important than ever.
That’s why Callan has improved our quarterly target date fund coverage by making the Callan Target Date Index™ website interactive. The new features include these improvements:
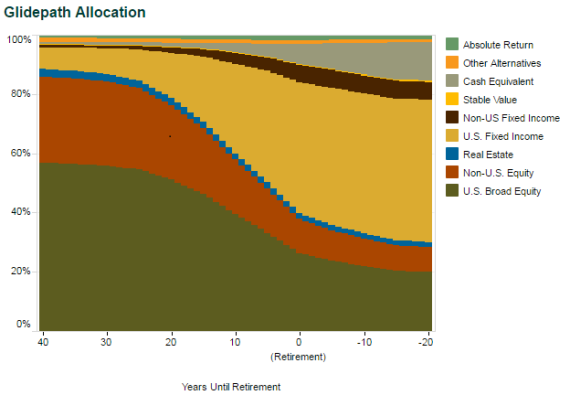
- The Target Date Index Glidepath Allocation chart provides insight into the underlying composition of the Target Date Index over the full glide path, with multiple views offering detail into asset allocation.

- The macro level view depicts the asset allocation over the course of the Index’s glide path (40 years before retirement to 20 years after retirement) across nine major asset classes.
- The micro level views show the asset allocation over the course of the Index’s glide path broken out into much more granular asset classes, with options to examine equity or non-equity asset classes separately.
- The Equity Rolldown analysis chart displays the Callan Target Date Index’s equity allocation across the full asset allocation glide path, from 40 years before to 20 years after retirement. It also shows each target date vintage’s equity exposure at the 10th and 90th percentile across the full glidepath. These features allow the industry to understand what is driving current target date fund performance.
TDFs started the year strong, with the median target date manager posting its highest return since 2013. The 4.4% median TDF return for the first quarter also outpaced the Target Date Index by 18 basis points.
Unlike 2016, TDFs benefited from their heavy exposure to non-U.S. equities in the quarter. While the S&P 500 Index reached new highs and rose 6.1%, the MSCI World ex USA Index performed even better, with a 6.8% gain. The average TDF has 26% of its equity exposure in non-U.S. developed markets during the accumulation phase (age 25-65 vintages). Diversification to bond markets was a drag on TDF performance, with the Bloomberg Barclays U.S. Aggregate Bond Index increasing a mere 0.8%. During the accumulation phase, target date managers average 14.7% in core U.S. fixed income.
Over the trailing five-year period, the median target date manager’s performance virtually matched that of the Callan Target Date Index—off by just 4 bps.
During the quarter, the spread between the best and worst managers was quite wide, with those in the 90th percentile delivering gains of 3.7% and those in the 10th percentile posting a 5.2% increase. For the trailing year, the median target date manager produced a 10.6% gain, with the best performers up 12.4% and the worst returning 9.0%.
Bolstered by greater equity exposure, long-dated vintages outperformed near-dated vintages during the first quarter and the trailing year: the median 2050 TDF jumped 5.9% in the quarter and 14.6% over the year, while the median 2010 target date fund gained 3.2% and 7.6%.
TDF fees have experienced tremendous downward pressure. The median target date fund’s expense ratio is 0.46%, ranging from 0.76% in the 90th percentile to 0.10% in the 10th percentile. Much of the difference is driven by active versus passive implementation of target date glide paths.
Callan updates its Target Date Index on a quarterly basis.
4.4%
The median return in the first quarter for TDF managers.

