June 30 is an important date for public defined benefit (DB) plans because that is their most common plan fiscal year-end. With inflation, Fed monetary policy, and a war in Ukraine dominating headlines, most plans saw sharp losses for the year ended 6/30/22. However, stakeholders should maintain some perspective, as the public DB plan returns for fiscal year 2021 were the strongest we’d seen for three decades.
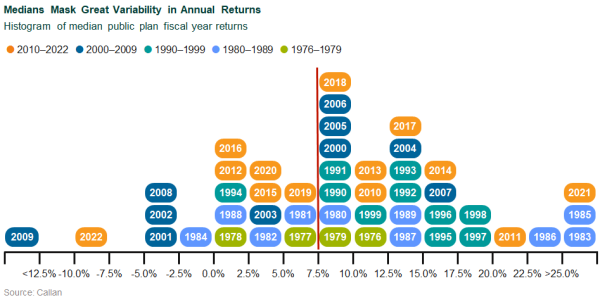
That said, 2022 will be remembered as one of the most painful years that public plans have witnessed, with the median plan’s loss of 9.4% in the neighborhood of 2009’s return, the worst year for which Callan has history. Pairing 2021 and 2022 together brings the two-year annualized median gain to 7.1%.
Public DB Plan Returns for 2022
Ranges of results were historically wide in 2022, suggesting that it was a year in which asset allocation drove results. The disparity of results is most evident looking at large plans (greater than $1 billion in assets) relative to small and mid-sized plans (below $1 billion in assets). Plans with higher allocations to private investments like real estate and private equity tended to record lower losses. For the year ended 6/30/22, private real estate returned 21.45% (NCREIF Property Index), versus -13.87% (Russell 3000 Index) and -10.29% (Bloomberg Aggregate Index) for public equity and core fixed income, respectively. Private equity returns report on a one-quarter lag—through 3/31/22 returns were 22.01% (Cambridge Private Equity).
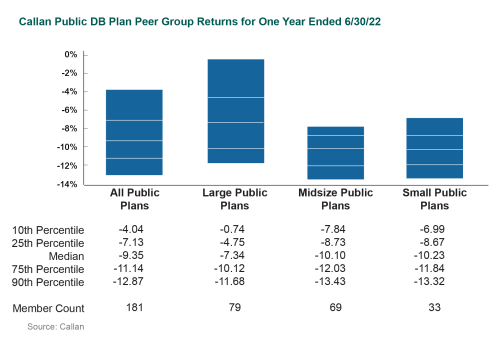
Larger plans have more capital to put to work and on average have higher allocations to these private investments, which oftentimes have asset minimums or require greater scale to build a diversified portfolio.
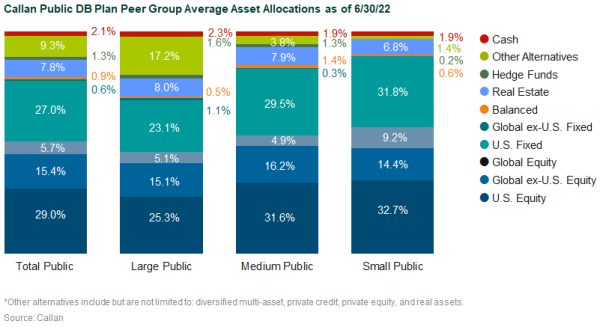
The Callan Public DB Plan Peer Group includes approximately 180 plans ranging from small (below $100 million in assets) and medium ($100 million to $1 billion) to large plans (greater than $1 billion in assets). Large plans have a meaningfully higher average allocation to other alternatives, which include private equity, private credit, or other real assets. Those plans that have larger allocations to private assets more than likely had better one-year results than plans that have no exposure to the private markets. It is worth noting that part of the improved return experience can be attributed to the lagged valuation mechanism of private equity and smoothing of returns in real estate. If those strategies marked to market similarly to public asset classes, we’d expect a more muted difference in results.
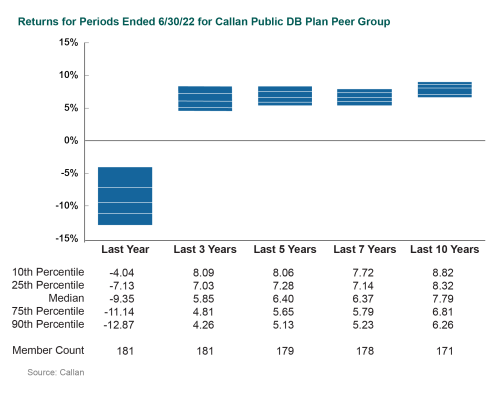
To put the results into perspective, many plans use performance over a rolling 5- or 10-year period in determining the actuarial required contribution. Using a 7.25% return hurdle, the majority of plans using a 5-year period would have to increase contributions on the margin. Considering the volatility of capital markets over the last few years, an actuarial value of assets that remain stable is dampening what would otherwise be felt in contribution volatility. Extending the performance period to 10 years, the majority of plans are still ahead of the return hurdle despite the dismal results suffered in 2022.
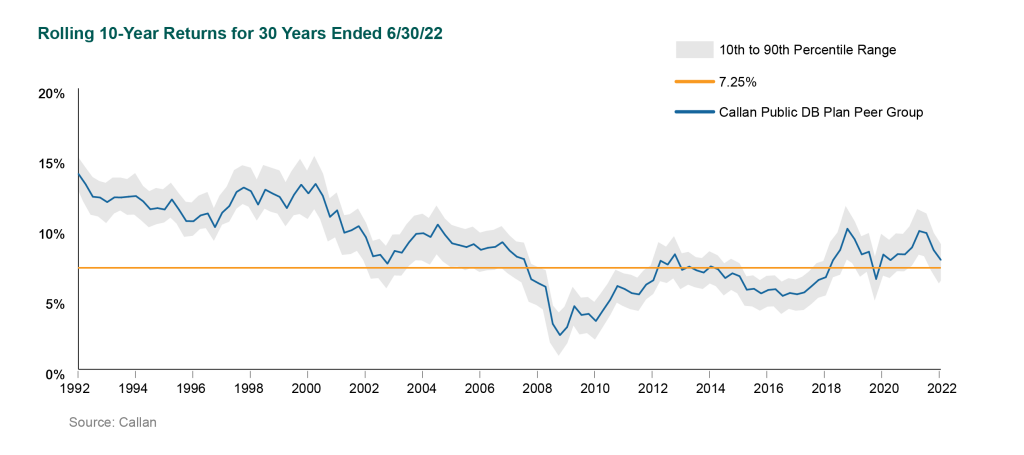
Plans should continue to emphasize long-term results, and be less reactive to near-term volatility. Over the last 30 years, the median public plan’s 10-year return has exceeded a 7.25% return hurdle in 69% of quarters. While 2022 will drag down long-term returns, the previous decade of performance will help public plan results and support a continued commitment to long-term strategic planning.
Disclosures
Certain information herein has been compiled by Callan and is based on information provided by a variety of sources believed to be reliable for which Callan has not necessarily verified the accuracy or completeness of or updated. This report is for informational purposes only and should not be construed as legal or tax advice on any matter. Any investment decision you make on the basis of this report is your sole responsibility. You should consult with legal and tax advisers before applying any of this information to your particular situation. Reference in this report to any product, service, or entity should not be construed as a recommendation, approval, affiliation, or endorsement of such product, service, or entity by Callan. Past performance is no guarantee of future results. This report may consist of statements of opinion, which are made as of the date they are expressed and are not statements of fact. The Callan Institute (the “Institute”) is, and will be, the sole owner and copyright holder of all material prepared or developed by the Institute. No party has the right to reproduce, revise, resell, disseminate externally, disseminate to subsidiaries or parents, or post on internal web sites any part of any material prepared or developed by the Institute, without the Institute’s permission. Institute clients only have the right to utilize such material internally in their business.


