Most private equity activity measures were down in 3Q20 compared to the previous quarter, a pattern that also held for most year-to-date comparisons. A rough averaging indicates a 30% drop in year-over-year private equity activity due to the pandemic, which reflects a reasonably healthy marketplace since the volumes were so strong in 2019. Private exits remain most affected but are expected to improve since pricing has rebounded, and they will serve as a “third leg” in the pandemic portfolio management process (after investment triage and new investments). Private equity allocations were advantageous for asset owners through the downturn as private equity indices had less than half the volatility and comparable or better first-half returns than public equity.
Fundraising: Travel Restrictions Emphasize the Known and Tenured
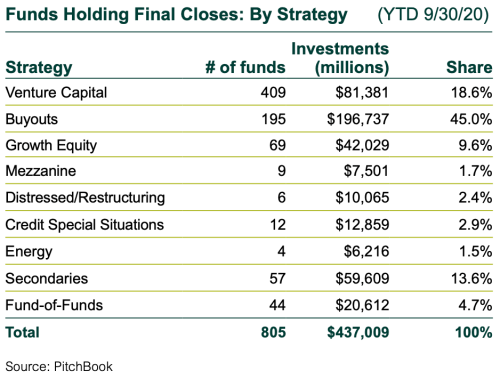
- The number of funds holding final closes in 3Q slowed to 224, down 12% from 2Q, and commitments fell to $107 billion, off 36%. But 4Q should produce a rush of closes.
- Year-to-date commitments are running 7% or $35 billion behind 2019, with the fund count of 805 down 18%. These are very strong run rates under challenging circumstances.
- With travel restrictions, investors are emphasizing reinvestments and new investments with longer-tenured managers.
- Energy and mezzanine are out of favor with investors, but other strategies are in line with historical market shares.

Buyout Investments: Narrowed Opportunity Set
- The pandemic has limited the number of industries and companies that would otherwise be attractive investment opportunities. The concentration of capital on the narrowed opportunity set, and the renewed emphasis on investing versus portfolio triage, is driving prices higher.
- The Wall Street Journal recently noted that 47% of 3Q private equity transactions involved technology companies, so the focus on software and other high-margin, recurring-revenue companies remains a perceived safe harbor.
- The number of transactions for the quarter totaled 1,500, up 31% from 2Q, but dollar volume fell 32%, totaling $65 billion.
- The YTD investment count and dollar volume are notably lower than 2019, with declines of 30% and 38% to 4,810 and $305 billion, respectively.
- Based on client portfolio reviews, GPs are continuing to deploy capital well within their investment periods of five to six years, and in as little as three years overall.
High Prices Are Back
- After falling to 9.2x in 1H20, average buyout prices rebounded to 11.0x EBITDA through 3Q.
- The average equity going into deals of 5.3x represents about 50% of acquisitions, so GPs are employing conservative, flexible structures.
VC Investments: Voted ‘Least Affected’
- Venture capital (VC) has been less affected by the pandemic than buyouts. Rounds of financing in 3Q fell by 13% to 6,234, but announced dollar volume rose 7% to $76 billion.
- 3Q had the fewest investment rounds year-to-date, but the largest quarterly announced dollar volume, in a tilt toward larger investments (e.g., SpaceX).
- YTD, the count dropped 27% to 21,937 rounds, but announced value of $212 billion is 5% ahead of 2019.
- Financing of unicorns (VC companies with valuations of over $1 billion) ticked up from the prior quarter with 59, up 12 rounds, with the $17 billion of announced funding up $3 billion.
- The median pre-money valuations of Series A through D rounds continued to rise, with only seed stage remaining flat.
PE-Backed M&A Exits: Ouch
- 3Q private equity-backed M&A exits rose 12% to 294, but dollar volume plunged 70% to $37 billion, even with help from the $11 billion mega-sale of Ellie Mae.
- Year-to-date exit activity is well behind 2019’s much stronger volume. The deal count dropped 41% to 1,139, and announced volume skidded 46%, totaling $241 billion.
- With the renewed multiple arbitrage between exit pricing and the entry prices five to seven years ago, GPs will likely focus on realizations in the next phase of the pandemic portfolio management process.
PE-Backed M&A IPOs: ‘Big’ Deal
- 3Q private equity-backed IPOs were helped by the strong July and August public market rise. Count rose 135% to 40, and total raised by 433% to $64 billion. The dollar jump is due to the $49 billion debut of Kakao Games in Korea.
- The YTD total of 71 lags last year by 16% or 14 IPOs, but the total raised is up 219% to $83 billion.
Venture-Backed M&A Exits: More Sales, but Fewer Proceeds
- 3Q VC exits remained weak with the count up 3% to 336, and announced proceeds falling 35% to $15 billion.
- Year-to-date venture-backed M&A exits by count were down 24% to 1,122, and announced proceeds were down 45% from a year ago to $57 billion.
Venture-Backed IPOs: Big Names Go Public, With More on the Way
- Capitalizing on rebounding public equity markets, venture-backed IPO exits in 3Q climbed by 53% to 122, and the combined new issuance surged 200% to $33 billion.
- Some notable unicorns debuted with Snowflake being the largest and garnering 10% of the dollar proceeds.
- The YTD total IPO count bests 2019 by 53% with 258 offerings, and dollar volume is up by 28% with $50 billion of aggregate proceeds.
- Airbnb announced that it plans to raise about $3 billion in an IPO, with a hoped-for valuation of around $30 billion.

Returns: PE Allocations Beneficial in Volatile Markets
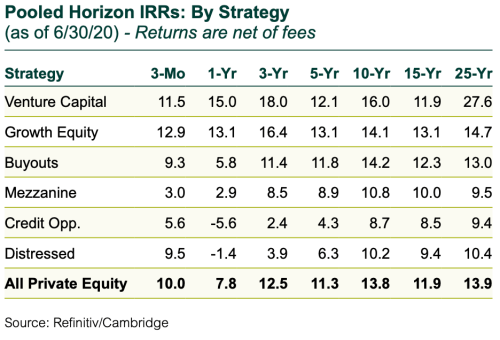
- After a strong equity market in 2019 (Russell 3000 Index: +31.0% and Cambridge PE Index: +16.3%), the first two quarters of 2020 have seen a large decline and strong recovery.
- In 1Q20 private equity fell 7.8% versus the Russell 3000 plunge of 20.9%, but the 2Q rally (Russell 3000: +22.0%) was also less pronounced for private equity with a 10% uplift.
- On a public market equivalent (PME) basis, the Refinitiv/Cambridge private equity database outperformed broad public equity indices over all horizons one year and greater, except the 10-year time span approximating the start of the bull market.
