Defined Benefit
Defined Contribution
Insurance Assets
Nonprofit

Periodic Table of Investment Returns

Callan’s Periodic Table: The Case for Diversification
clock

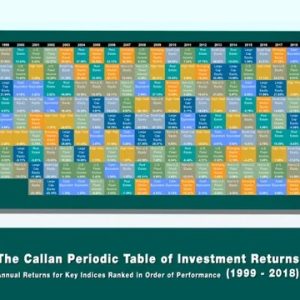
One glance at the crazy quilt of colors in the Periodic Table of Investment Returns suggests the challenge investors face in picking an investment class “winner” year-by-year and illustrates the benefit to diversification.

Callan Periodic Table

Last year offered investors a wild ride, with sentiment overwhelming fundamentals for much of 2016. Bonds rose in value and stocks fell through the Brexit vote in June and the U.S. presidential election in November, only to reverse course at the end of the fourth quarter. U.S. stocks surged, and the S&P 500 notched a 12% gain for the year, after a meager 1.4% increase in 2015. Bonds were up 2.7% (Bloomberg Barclays U.S. Aggregate Index), reflecting a retreat in value as interest rates rose in the fourth quarter, but actually showing an improvement in total return over 2015. Value and small cap U.S. stocks enjoyed banner years, with small cap value (Russell 2000 Value) leading the pack, jumping almost 32% after a loss of 7.5% in 2015. Emerging market equities enjoyed a similar reversal, gaining 11.6% after suffering a loss of 14.6% in the prior year. Developed market equities outside the U.S. (MSCI EAFE) trailed the pack, and eked out a return of just 1%.

The rankings of the various asset classes across the capital markets have been all over the map on a year-by-year basis since the Global Financial Crisis, with equity strategies returning as much as 43% in one year (Small Cap Growth in 2013) and suffering losses as great as -18% (Emerging Markets in 2011), all while the global equity markets were enjoying a broad bull market run. During this same period, the Bloomberg Barclays Aggregate ranked both first (2011) and last (2010 and 2012), all while generating a return in a very narrow range from -2.0% to 7.8%. The Periodic Table is a reminder that the results from investing are far from certain, and that absent the ability to pick the winner in advance, diversification is key to managing the risk of an investment portfolio.

The Callan Periodic Table of Investment Returns depicts annual results for various asset classes, ranked from best to worst, for the last 20 years. Each asset class is color-coded for easy tracking. Well-known, industry-standard market indices are used as proxies for each asset class. It is one of Callan’s most recognized pieces of research, widely cited in the media and much anticipated by our clients.

Posted by

Share
Share on facebook
Share on twitter
Share on linkedin
Related Posts
Operations

A Deeper Look at How We Did With Our Capital Markets Assumptions

Julia Moriarty
An analysis of how Callan's Capital Markets Assumptions performed over time by asset class.
Private Markets

ILS on Pace for Banner Year in 2023

Sean Lee
Sean Lee discusses the returns for insurance-linked securities (ILS) for the year-to-date.
Operations

How Your Public DB Plan's Returns Compare | 2Q23 Update

Public DB Plan Focus Group
Callan Public DB Plan Focus Group provides an update on plan returns and analysis of how they compare over time.
Operations

How Your Public DB Plan's Returns Compare | 1Q23 Update

Public DB Plan Focus Group
Callan Public DB Plan Focus Group provides an update on plan returns and analysis of how they compare over time.
Operations

Callan’s 2023 Capital Markets Assumptions: A Behind-the-Scenes Look

Capital Markets Research
This blog post details the process and reasoning behind the Callan Capital Markets Assumptions for 2023-2032, and provides detailed information about ...
Operations

Financial Wellness: Is It the Right Prescription for Your DC Plan?

Jana Steele
Jana Steele provides a summary of her recent white paper on financial wellness options for DC plans.
Private Markets

Alignment of Interests: Best Practices to Make Sure Investors and Their Managers Are in Sync

Real Assets Consulting Group
Callan expert discusses how institutional investors can make sure their interests are aligned with their private markets investment managers.
Private Markets

Investing in Data Centers: The Real Assets of the Digital Age

Lauren Sertich
Lauren Sertich provides a summary of her recent paper on investing in data centers.
Macro Trends

Hedge Funds and Ukraine: A Guide for Institutional Investors

Joe McGuane
Joe McGuane analyzes hedge fund performance in 2022 and how managers are handling the volatility stemming from the invasion of Ukraine.
Operations

A High-Level Summary of the Callan 2022-2031 Capital Markets Assumptions

Capital Markets Research
This blog post details the process and reasoning behind the Callan Capital Markets Assumptions for 2022-2031, and provides detailed information about ...

Callan Family Office

You are now leaving Callan LLC’s website and going to Callan Family Office’s website. Callan Family Office is not affiliated with Callan LLC.  Callan LLC has licensed the Callan® trademark to Callan Family Office for use in providing investment advisory services to ultra-high net worth clients, family foundations, and endowments. Callan Family Office and Callan LLC are independent, unaffiliated investment advisory firms separately registered with the Securities and Exchange Commission under the Investment Advisers Act of 1940.

Callan LLC is not responsible for the services and content on Callan Family Office’s website. Inclusion of this link does not constitute or imply an endorsement, sponsorship, or recommendation by Callan LLC of their website, or its contents, and Callan LLC is not responsible or liable for your use of it. When visiting their website, you are subject to Callan Family Office’s terms of use and privacy policies.