This blog post from Callan’s Private Equity Consulting Group provides a high-level summary of private equity activity in the second quarter through all the investment stages, from fundraising to exits, as well as performance data across a range of market cycles. (Investment-stage data provided by PitchBook; performance data from Thomson Reuters/Cambridge.)
Fundraising: Slow Then Go
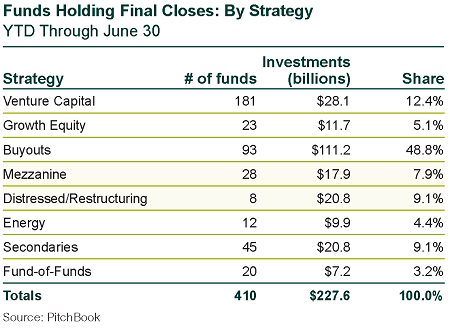
The number of funds holding final closes in the second quarter totaled 205, unchanged from the first quarter, but total commitments of $106 billion declined by 12%. First-half final closes lag 2017’s pace, with the fund count down 24% and commitments down 27%.
Fundraising is in a lull after a wave of fund formation from 2015-2017. We expect fundraising to begin to cycle up again in 2019 or 2020 when previous funds approach full deployment.

The fact that buyouts represented less than half of the total of funds holding final closes by strategy in the quarter, and venture plus growth is in the high-teens, indicates that institutional investors continue to pursue broad diversification.
In addition, debt strategies continue to be of interest.
And while there is recognition that secondary prices are high, secondary funds are garnering significant amounts of capital. Finally, investors are returning to energy, but with a degree of caution.
Largest Funds Holding Final Closes
- GSO Capital Solutions Fund III, distressed debt, $7.1 billion
- Carlyle Asia Partners V, buyout, $6.6 billion
- Sequoia Capital Global Growth Fund III, venture capital, $6.0 billion
- No. 1 European Fund: Nordic Capital Fund IX, buyout, $5.1 billion
- No. 1 Asia-Pacific Fund: Carlyle Asia Partners V, buyout, $6.6 billion
Global Company Investments: Slower Pace in 2018
Private equity investment into companies in the second quarter declined 10% from the first quarter, and the announced value dropped 19%. The first half of 2018 also fell from 2017’s totals. Company investments declined by 393 (-11%) and announced value lagged by $98 billion (-28%).
Year-to-date average buyout prices have declined from 2017’s record high. The first-half volatility in public equity market pricing may be having an influence on private equity. A moderation in prices is a welcome event.
Average debt levels backed off less than pricing in the first half of the year, indicating that leverage in investments continues to increase.
Largest Buyout Investments
- Toshiba Memory, storage (IT), $18 billion
- TDC, telecom service provider, $6.7 billion
- AccorInvest, hotels and resorts, $5.5 billion
VC Investments: Rise of the Unicorns
The number of rounds of financing fell in the second quarter by 17%, but announced dollar volume ballooned 41% to an eight-quarter high. The anomalous $14 billion mega-financing for Ant Financial played a key role in the jump. First-half financings lagged 2017 by 27%, but announced dollar volume was up 95%, a $682 billion increase, with later-stage rounds accounting for much of that.
In 2Q18 there were 26 financings of unicorns (VC companies with valuations of over $1 billion), compared to 17 in 1Q18, with a total of $28 billion being invested. Later-stage mega-rounds with consortiums of venture funds, public equity managers, and sovereign wealth investors are a hallmark of the current venture cycle.
Largest VC Financings
- Ant Financial, financial software, $14 billion, 4th round, led by Warburg Pincus
- Weltmeister, automotive, $3.2 billion, 2nd round, follow-on financing from Baidu Ventures and new financing from China Minmetals, China Structural Reform Fund
- Pinduoduo, internet retail, $3 billion, 3rd round, led by Tencent Holding with new financing from Sequoia Capital
PE-Backed M&A Exits: Big Plunge from 2017’s First Half
Private equity-backed M&A exits (excluding venture capital) were down slightly for the quarter by 34 sales (-6%) and $18 billion of announced value (-13%). But compared to the first half of 2017, M&A exits were down more steeply, with 313 fewer sales (-22%) and $126 billion less of announced value (-32%).
Largest PE-Backed M&A Exits
- Westfield, asset management, $25 billion
- GKN Group, construction and engineering, $10.9 billion
- Blue Buffalo, specialty retail, $8 billion
PE-Backed IPO Exits: Steep Rise in Money Raised
Private equity-backed IPO exits (excluding venture capital) increased in the second quarter by 10 offerings (+26%) and a combined float of $4 billion (+33%). Compared to 2017, first-half IPOs were 21 fewer by count (-19%), but raised in aggregate $8 billion more (+38%).
Largest PE-Backed IPO Exits
- Vinhomes, real estate services, $1.4 billion
- CEVA Logistics, logistics, $1.2 billion
- Ping An Good Doctor, enterprise systems (health care), $1.1 billion
Venture-Backed M&A Exits: Mixed Results in Quarter, Year-to-Date
Venture-backed M&A exits were down modestly for the quarter by 33 sales (-10%), but announced value rose by $718 million (+4%). Venture-backed M&A exits by count were down more steeply relative to the first half of 2017 with 174 fewer sales (-21%), and announced value fell $6 billion (-13%).
Largest Venture-Backed M&A Exits
- Mobike, transportation infrastructure, $2.7 billion
- Callidus Software, business/productivity software, $2.4 billion
- iZettle, financial software, $2.2 billion
Venture-Backed IPO Exits: Strong Gains Over Last Year
Venture-backed IPO exits increased in the second quarter by 33 offerings (+114%) and the combined float increased $5 billion (+149%). Compared to 2017, first-half IPOs were 8 more by count (+10%), but raised in aggregate $3 billion more (+29%).
Largest Venture-Backed IPOs
- Mercari, social/platform software, $1.1 billion
- Adyen, financial software, $991 million
- DocuSign, business/productivity software, $630 million
Performance: Private Equity Returns Top Public Markets


