Over the past several years the performance of the U.S. equity market has widely outpaced the rest of the world. Part of the reason for that outperformance has been the superior growth trajectory in the U.S. following the Global Financial Crisis (GFC), and part stemmed from the expansion of multiples in U.S. equities.
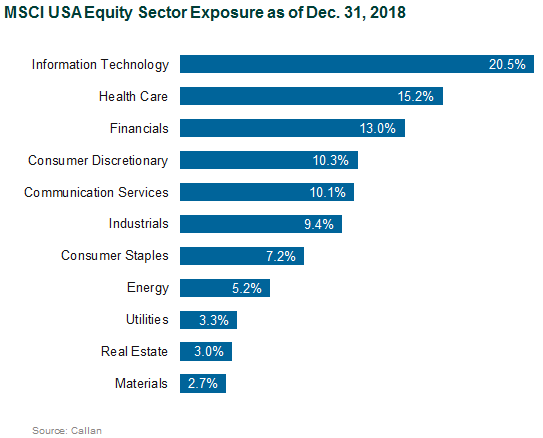
Another less discussed aspect of that relative outperformance involves sector concentration. In the U.S., the Information Technology (IT) sector dominates the market. At the end of 2018, over 20% of the MSCI USA Index was represented by IT companies—the largest sector in the index.

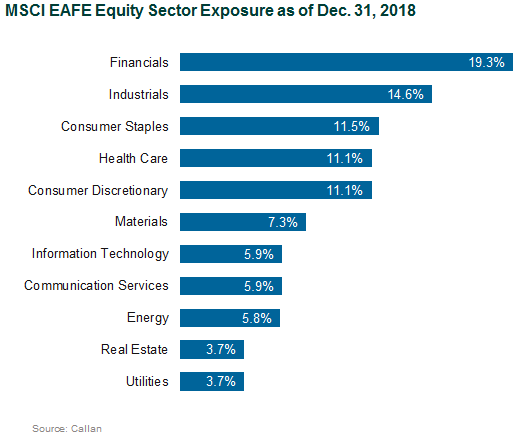
Conversely, IT represents a mere 6% in the non-U.S. developed markets, defined by the MSCI EAFE Index. The largest sector within EAFE is Financials, at nearly 20%. In contrast, Financials represents 13% of the U.S. index.

Given the extraordinary returns of many big-name U.S. IT companies (e.g., Apple, Amazon, Facebook), it is no surprise that U.S. equities have fared so much better than their non-U.S. counterparts. (Those successes, of course, are facing near-term headwinds; more on that subject later.) On the other hand, Financials have struggled, both in the U.S. and outside this country, from low net interest margins and increased regulation following the GFC and European debt crises. (But those headwinds may be easing up.)
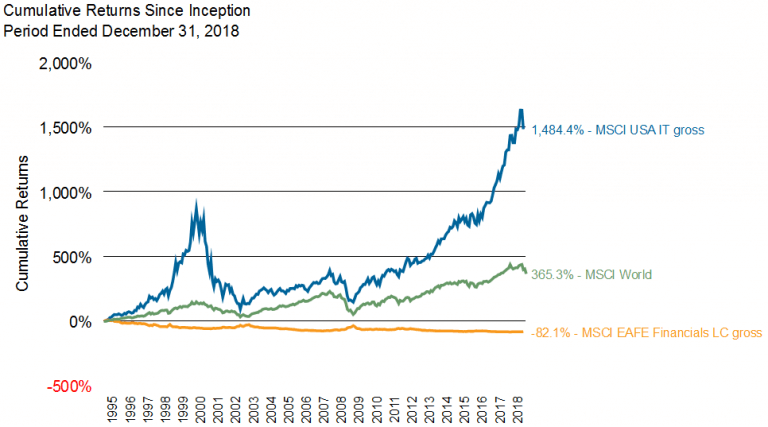
The chart below illustrates the extraordinary gap in performance between those two sectors. We’ve focused on local currency (LC) return streams to isolate the equity effect, since U.S. dollar returns are affected by foreign currency changes.

Emerging markets have also lagged the U.S., but the sector concentration story has an interesting twist. The largest sector in the MSCI Emerging Markets Index is Financials, at over 27%. But IT is second largest at 12.8%. So, you get the drag from Financials with the EM index, counterbalanced by the boost from IT (e.g., Alibaba or Tencent).
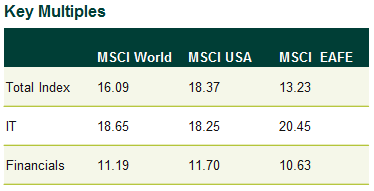
Of course, there’s more to this story than performance divergence. Consider relative valuations (and the exposures to those valuations). At the end of 2018, for instance, P/E ratios for IT were 18.65 for MSCI World, 18.25 for MSCI USA, and 20.45 for MSCI EAFE. Much has been written about the higher valuations in the U.S., but a closer look reveals that within IT, multiples are actually higher in EAFE than the U.S. However, the U.S. index holds much more IT—boosting the overall index valuations more than for EAFE. Overall index valuations are affected as much by the size of a sector as the relative valuations within the index.

The bottom line: Investors considering the elimination or reduction of non-U.S. equity exposure are also making a much larger bet on IT versus Financials. Since these two sectors dominate the U.S. and EAFE, respectively, tilting a portfolio to the U.S. is assuming higher exposure to IT and lower exposure to Financials.
A word of caution from investors, like me, old enough to have lived through the Dot.Com Bubble. Remember Pets.com? It took over a decade for IT to recover from that bubble popping. Even though EAFE Financials have lagged the broader market consistently, the sector beat U.S. IT for over a decade following the tech bubble. And while IT made exceptional gains in early 2018, by the end of the year and into early 2019, U.S. IT, and IT in general, has faced heightened volatility.
The moral of this story: Don’t write off non-U.S. equities just yet. Callan continues to recommend broadly balanced equity exposure—U.S. and non-U.S.—and disciplined rebalancing as the best course for institutional investors to accomplish the long-term objectives for their portfolios.

