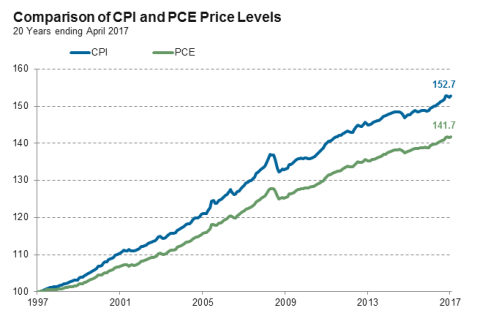
Because of its extraordinary response to the Global Financial Crisis, investors scrutinize the actions of the Federal Open Market Committee (FOMC) more than ever. Since 2000, the Fed’s preferred measure to set its 2% target rate for inflation has been the personal consumption expenditures (PCE) index. Despite these developments, the consumer price index (CPI) remains synonymous with “inflation” and is more closely followed. With that in mind, it is instructive to examine how these inflation benchmarks differ.
To start, it might be helpful to look at the history behind the PCE’s adoption. In January 1995, then-Federal Reserve Chairman Alan Greenspan began arguing that the CPI overstates inflation by 50 to 150 basis points per year. This ultimately led the Fed to embrace the PCE index.
In a February 2000 report, when the official switch was made, the Fed cited several advantages of the PCE index compared to the CPI:
- The PCE formula reflects the changing composition of spending, which better aligns with consumer behavior
- Its weights are based on a more comprehensive measure of expenditures
- Historical data used in the PCE can be revised to account for new information and improved measurement techniques
According to this report by the Bureau of Labor Statistics and the Bureau of Economic Analysis, four main sources contribute to differences between the benchmarks. These four effects tend to cause the growth rate of the CPI to exceed that of the PCE:
Formula Effect: The CPI uses a fixed-weight price index in which a specific basket of goods is selected and prices for that same basket are compared across periods. The PCE uses a floating-weight price index that allows the basket of goods to change. Therefore, the PCE better reflects substitution by consumers as they trade items that have increased in price for lower-cost items. Because the CPI basket is fixed every two years, price changes tend to be higher, contributing to bigger changes in the CPI than the PCE.
Scope Effect: The CPI measures out-of-pocket expenditures of all urban households while the PCE measures purchases by individuals and by nonprofit institutions as well as certain items purchased on behalf of individuals. The difference is most notable in health care. In addition to services directly purchased by consumers, the PCE includes employer-paid health insurance and government programs such as Medicare and Medicaid. Naturally, this has contributed to bigger changes in the PCE than the CPI.
Weight Effect: The CPI weights are based on a household survey while the PCE weights are primarily based on business surveys. These varied sources create different component weights for the two measures. Additionally, the broader scope of the PCE reduces the weight to components such as housing, which has the largest weight in the CPI. As a result, rent has historically been the largest differentiator between the measures and tends to generate bigger changes in the CPI than the PCE.
Other Effects: This includes seasonal adjustment differences and price differences.

The chart above shows that over the last 20 years the PCE has grown at an annual rate of 1.76% while the CPI has increased 2.14%. This relationship holds over longer time periods as well; historically the CPI measures inflation about 40 to 50 bps higher per year than the PCE.
Although the Fed continues to look at a variety of economic indicators, when considering inflation it is helpful to understand the key differences between the two measures. As a prime example, year-over-year CPI has been tracking above 2% each month since December 2016 while year-over-year PCE exceeded 2% only once during that time, in February 2017. So far this has not prevented the FOMC from raising its target rate, but it bears watching whether this will have an impact.
38
The difference in basis points between the CPI and the PCE over the last 20 years.

