This blog post from our Corporate DB Plan Focus Group is one in a series of monthly updates about the impact of interest rates on corporate defined benefit (DB) plans, designed to highlight trends in the market and inform plan sponsors about significant developments. See all posts in the series here.
Discount Rate Trends
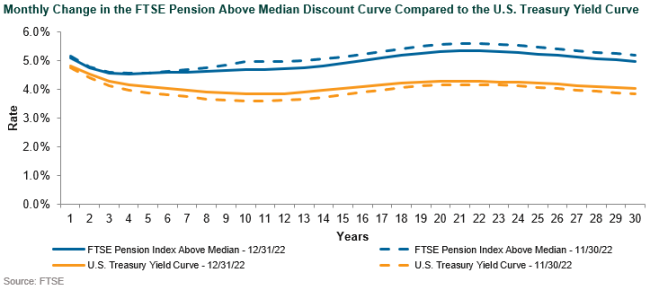
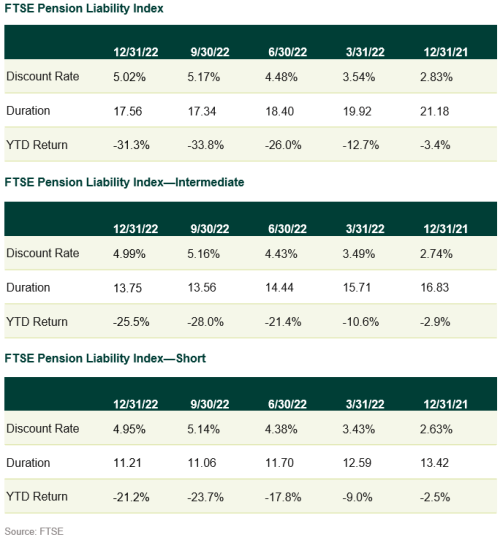
Discount rates rose slightly in December, and not surprisingly, ended the year almost two times higher than the beginning of the year. To put things in perspective, the single equivalent discount rate (as measured by the FTSE Pension Liability Index) climbed by 219 bps, from 2.83% to 5.02% in 2022, whereas calendar years 2021 and 2020 experienced a 30 bps increase and a 70 bps decrease, respectively. Discount rates last approached 5% in 2013. In fact, August 2011 marks the last time discount rates were actually above 5%. The single equivalent discount rate for Callan’s illustrative plan (representing a typical shorter-duration corporate DB plan and which compares to the liability duration of FTSE’s Pension Liability Index–Short) increased marginally, by 6 bps, to 5.23% in December. Both rate and spread movements were negligible during the month, which generally encompasses a period of light trading volume on account of holiday closures. Bloomberg Long AA Corporate spreads fell by 2 bps in December, in contrast to November’s 19 bps move. Yields on the 10-year Treasury note increased from 3.69% at the end of November to 3.80% at year end. Recall that the 10-year Treasury note began 2022 at a yield of 1.49% and climbed steadily throughout the year, reaching a peak of 4.23% on Oct. 24 before ending the year at 3.80% (a 2.5x increase). What a momentous year!
As we move into 2023, the one thing we know for certain is the uncertainty that this coming year will bring. The Federal Reserve has expressed no intention of stopping quantitative tightening (QT), but it is acknowledging improvement in inflation prints. This has the probability of exacerbating rate volatility, which from historical experience has been the key driver of fixed income returns. Additionally, we are starting the year with a sharply inverted yield curve, the economy is teetering on recession, and credit conditions are tightening—which in turn has prompted layoffs across sectors. While spread movements were largely range-bound in 2022, we would expect increased volatility in both rates and spreads in 2023.

Pension Liability Index Detail
Discount rates ended the year inside the level at 3Q22 end, but almost two times that at the beginning of 2022, as noted above. Interestingly, the spread between the full FTSE Pension Liability Index (~17.6-year duration), Intermediate Index (13.8-year duration) and Short Index (11.2-year duration) single equivalent discount rate was only 7 bps at the end of 2022. In contrast, the spread between the three indices’ discount rates as of year-end 2021 was 20 bps. Not surprisingly, as interest rates have increased materially, most plans’ liability duration has fallen by 2-3 years, more so for longer-duration liabilities. As a result of liability decay (i.e., aging demographics), duration adjustment due to the higher rate environment, and derisking events from additional movement along glidepaths, some plans found themselves in an overhedged position during the year. This necessitated inclusion of shorter- to intermediate-duration assets, and in some instances less credit-sensitive assets.

Strategy Decisions
It’s easy to look back and reflect on what corporate DB plan sponsors could have done last year. More important is to focus on what they did accomplish over the past year. While luck played a role, skill and planning were the keys to success. While experience differed by client, on the margin, Callan’s corporate clients experienced funded status increases over the period. For those plans that were not well hedged from an interest rate perspective, 2022 may rank as one of the largest increases in funded status in the history of the plan. As evidenced by the table above, liabilities shrank by anywhere from 21% (shorter-duration liabilities) to a whopping 31% (FTSE full Pension Liability Index). For those plans that were well hedged, our experience indicates that funded status was largely range-bound, fluctuating within +/-1% of where it started the year. Of course, this assumes that no exogeneous activity such as contributions, pension risk transfers, change in actuarial assumptions, or unexpected demographic experiences occurred causing distortions in funded status over the period.
So, what now? Regardless of where a plan is on the spectrum of less well-funded to well-funded, it’s likely time to do a risk refresh. Capital markets assumptions have generally undergone major overhauls, and sponsors might be surprised at where their risk appetite is today versus where they started the beginning of last year. Is it time to extend duration to take advantage of rate increases? Or perhaps the stretch (rather than reach) for yield isn’t so attractive now. Maybe this is simply a time to refresh, start with a clean slate, and prepare the portfolio for what could be a rocky ride.
Disclosures
The Callan Institute (the “Institute”) is, and will be, the sole owner and copyright holder of all material prepared or developed by the Institute. No party has the right to reproduce, revise, resell, disseminate externally, disseminate to any affiliate firms, or post on internal websites any part of any material prepared or developed by the Institute, without the Institute’s permission. Institute clients only have the right to utilize such material internally in their business.

