This blog post from our Corporate DB Plan Focus Group is one in a series of monthly updates about the impact of interest rates on corporate defined benefit (DB) plans, designed to highlight trends in the market and inform plan sponsors about significant developments. See all posts in the series here.
Discount Rate Trends
Longer-term yields rose in June, increasing from 3.63% (10-year Treasury yield as of May 31) to 3.80% at the end of June. Yields were largely range-bound for much of the month; however, they jumped at month end on stronger than-expected economic data. Economic releases toward the end of the month (housing data (rebounding), jobless claims (largest decrease in 20 months), and positive GDP growth (+2% in 1Q)) caused the yield curve to bear-flatten (i.e., short-term rates increased while long-term rates remained anchored).
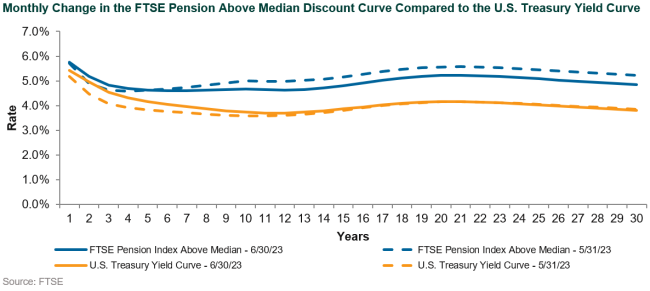
The FTSE Pension Above Median Discount Curve bear-steepened at the front end, but bull-flattened through the belly and back end of the curve. Spreads tightened over the month, which helped offset the impact of short-term rate increases, and led to discount rates lowering over the month. Specifically, long credit spreads started the month at 161 bps over like-duration Treasuries and ended the month 13 bps lower at 148 bps.
Taking a slightly longer-term perspective, a one standard deviation band around the 10-year Treasury places yields in the 3.42% – 3.80% range. With the exception of mid-February through the end of March, when the economy switched from a risk-on sentiment to a flight-to-quality trade stemming from systemic concerns in the U.S. banking sector and two bank failures, rates have bounced around in this band. This is in stark contrast to the 164 bps increase in the 10-year Treasury between August and November 2022.
Long credit spreads have been range-bound year-to-date as well (with the exception of March where they reached 175 bps over Treasuries). For a majority of the year-to-date period spreads have ranged between 142 bps and 166 bps, ending the quarter at 148 bps over like-duration Treasuries.
Pension Liability Index Detail
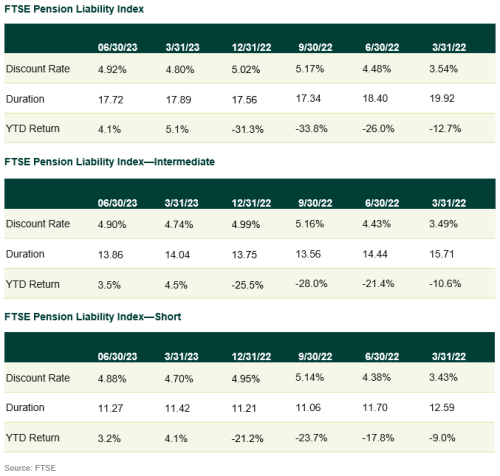
Relative to the end of May, the discount rate for the FTSE Pension Liability index dropped slightly, from 4.98% to 4.92% at the end of June. Quarter-over-quarter, the index is up 12 bps, reflecting an increased appetite for risk in the market and the Fed’s continued hawkish stance in raising short-term rates to fight inflation.
Intermediate and Short Pension Liability Index discount rates tightened during June, with the three indices ranging within 4 bps of each other (4.92% Full index, 4.90% Intermediate index, and 4.88% Short). This is the tightest the discount range has been among the various indices since February 2023.
Risks to the Back-end of the Curve
A common question in our Corporate DB client meetings is when will the Fed change from a hawkish stance to a dovish one. We know about as much as anyone else on the subject, which is that any pivoting from rate hikes to rate cuts will be data-dependent, driven in large part by labor and inflation prints. An ancillary question we often receive is, “What is the expected impact on long-term interest rates?” Our magic eight ball says “Stay Tuned,” but if we were a betting crew, we would envision the following four factors could place pressure on rates, perhaps keeping them range-bound if not slightly higher (outside of the Fed’s explicit changes to the discount rate):
- Overall Treasury supply
- The winding down of U.S. quantitative easing (QE)
- Japan’s yield curve control
- Prevalence of “natural buyers”
In fact, our capital markets assumptions suggest there is ~50 bps of movement still to go in long-term interest rates.
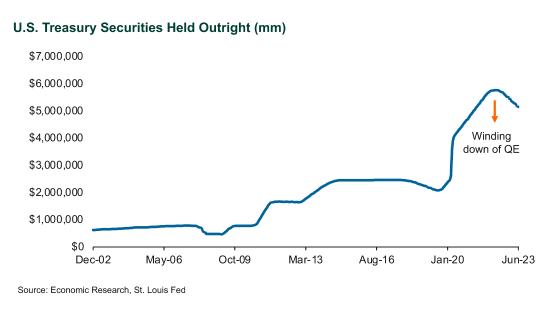
Fed’s Balance Sheet: Starting with the winding down of QE and Treasury supply, it’s still amazing to us how much the Fed’s balance sheet expanded during the pandemic. It dwarfs the monetary stimulus provided in 2008-09. As a quick recap, the Fed’s balance sheet expanded from $2.5 trillion in U.S. Treasury securities held as of the end of February 2020 to a peak of $5.8 trillion in June 2022. This is mostly comprised of notes and bonds. The $5.8 trillion does not include the additional $2.5 trillion of mortgage-backed securities that the Fed purchased.
In May 2022, the Fed announced its decision to reduce its balance sheet in a concerted fashion by adjusting the amounts of reinvested principal. The cap currently stands at $60 billion per month for Treasuries and $35 billion per month for agency MBS. This has resulted in a reduction of approximately $624 billion in Treasury holdings since May of last year, or nearly $50 billion per month. Assuming the $60 billion-per-month cap holds, all else equal, it will take ~44 month to get back to pre-pandemic levels. Of course, there is always the option to increase the cap, which would place pressure on long-term rates.
Japanese Yield Curve Control: The Bank of Japan (BOJ) enacted yield curve control (YCC) along with quantitative and qualitative monetary easing (QQE) in an effort to stabilize prices and promote inflation to a targeted 2% threshold. More specifically, the BOJ’s goal under YCC and QQE was to reach price stability by suppressing long-term yields. Japan’s inflation has been below 1% for the 15 years preceding 2022, so ultimately increases in wages and inflation are desired. YCC pegs long-term yields within a specified range +/-50bps through direct intervention by the BOJ (buying and selling as needed) in the Japanese government bond (JGB) market to hit that rate target. Since the BOJ has successfully kept JGB yields in a tight range (+/-0.3%) for the past seven years, loosening that control and allowing JGB yields to rise will make JGBs more attractive for domestic investors. The more attractive domestic investments are, the higher the likelihood that domestic investors begin to prefer domestic holdings over higher-yielding foreign bonds (e.g., Treasuries). This ultimately would place pressure on Treasury yields, causing them to rise. Japan is the second-largest holder of U.S. Treasuries after the U.S. at $1.1 trillion.
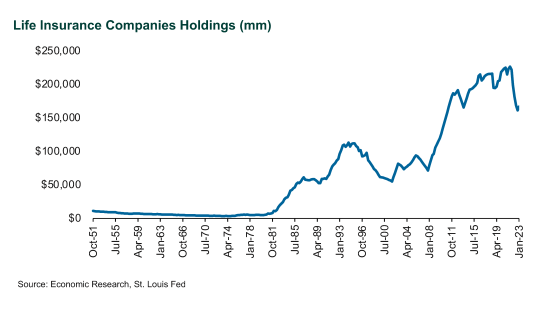
Natural Buyers: Appetite for pension assets among life insurers continues to grow as evidenced by year-over-year increases in pension risk transfer premiums. There are many natural buyers of long-term Treasuries (pensions, sovereign wealth funds, other central banks and official institutions, and insurance companies), but we’ve chosen to write about insurers given their active role with pensions. In the chart below, we illustrate the Treasury note/bond holdings of life insurance companies, as tracked by the Federal Reserve. As illustrated, the dollar value of Treasury holdings has increased enormously over the past decade—really beginning in 2010, where the pension risk transfer became a strategy for managing long-term pension risk. A meaningful change in the appetite for Treasury holdings vs. other holdings (e.g., agency mortgages, or high-quality corporate debt) could have an impact on long-term yields. It should be noted that the dollar value of these holdings is influenced by both issuance as well as changes in yields (e.g., the drop in value in 2022 is likely related to the increase in yields, rather than a change in appetite for Treasury debt).
Regardless of the reason, there are many potential outcomes that can influence the shape and movement of the yield curve. Because we will never be able to predict short-term macroeconomic outcomes, the best offense is the defense of an appropriate hedging strategy. Understanding the impact of changes in interest rates, spreads, and any return-seeking exposure on the portfolio can help institutional investors make an informed decision and, importantly, quantify which level of risk an investor’s Investment Committee is comfortable taking.
Disclosures
The Callan Institute (the “Institute”) is, and will be, the sole owner and copyright holder of all material prepared or developed by the Institute. No party has the right to reproduce, revise, resell, disseminate externally, disseminate to any affiliate firms, or post on internal websites any part of any material prepared or developed by the Institute, without the Institute’s permission. Institute clients only have the right to utilize such material internally in their business.

