This blog post from our Corporate DB Plan Focus Group is one in a series of monthly updates about the impact of interest rates on corporate defined benefit (DB) plans, designed to highlight trends in the market and inform plan sponsors about significant developments. See all posts in the series here.
Discount Rate Trends
As the thought of spring break kicked in around the country, marking a return of leisure travel, a mid-tier bank announced plans to raise more than $2 billion in sponsor capital and common equity. When the markets opened the following day, the stock price of that mid-tier financial institution, Silicon Valley Bank, fell by 30%, and multiple venture capital firms were reported to be pulling money from the institution. By the end of the day, on March 9, the bank’s common equity was down 60%, wiping out approximately $80 billion in value while bank customers initiated a massive $42 billion in withdrawals on concerns that their deposits were at risk.
The next day, the California Department of Financial Protection and Innovation (DFPI) took possession of SVB, citing “inadequate liquidity and insolvency” and marking the largest U.S. bank failure in history. Ultimately the Federal Deposit Insurance Corporation (FDIC) was named receiver with approximately $175 billion in customer deposits placed under its control. As many of SVB’s customers were corporations, the $250,000 deposit guarantee from the FDIC covered negligible amounts.
In rather quick succession, customers also sold positions in First Republic and Signature Bank, which gave rise to regulators placing Signature Bank in receivership and First Republic receiving deposits of $30 billion from 11 outside banks. At the same time, Credit Suisse announced it would borrow 54 billion Swiss francs from the Swiss National Bank. Ultimately UBS stepped in to assume Credit Suisse, but the deal was structured in a way to wipe out the layer of contingent convertible capital (CoCos) to the benefit of equity holders.
Markets took March’s financial sector news poorly, and the 10-year Treasury fell from 3.96% on March 8 to 3.68% on March 10 and remained largely range bound between 3.4% and 3.6% through the end of the month. Of the 7,503 issues in the Bloomberg US Corporate Bond Index, roughly 14% are issued by banks. Investment grade spreads on banks (full market index, not long) rose from 120 bps on March 8 to 191 bps on March 15 over concerns of broader potential contagion among financial sector issuers. The long credit index is less exposed, with only 122 of 3,228 long credit issues from banks. It should be noted that the asset/liability mismatch that led to problems for SVB was not widespread among the larger, money-center banks, which have largely been the recipients of deposits during this period.
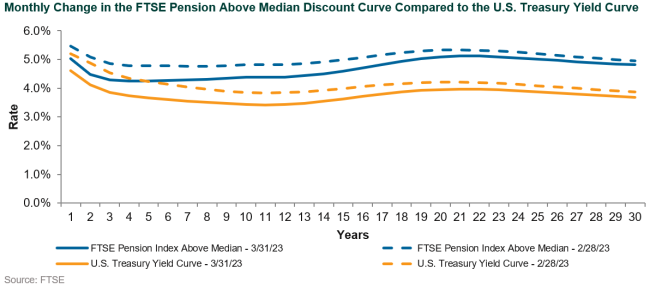
You may be wondering what the impact was on broader credit markets. Long credit spreads backed up 20 bps over the period between March 8-15, increasing to 175 bps over like-duration Treasuries and reflecting the general risk-off sentiment in the market. Industrials, which comprise approximately 57% of corporate issuance, sold off as well; however, spreads increased only 29 bps from 122 bps to 151 bps over the same 7-day period in mid-March. By the end of the month, between the Fed and banking regulators, the market regained some confidence with long credit spreads reverting to 160 bps over Treasuries. Not surprisingly, both the discount curve and Treasury curve shifted down, and steepened at the front-end over the month as can be seen in the chart below.

Pension Liability Index Detail
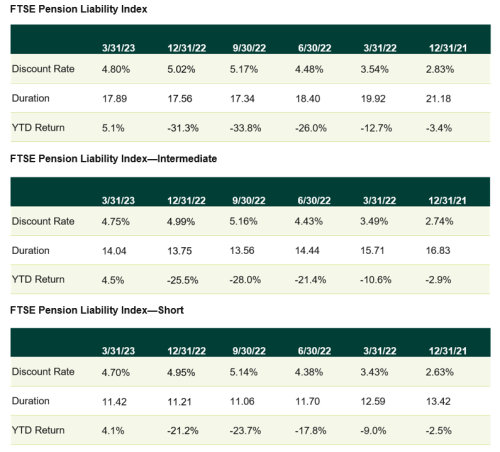
At the beginning of the year, we predicted that 2023 likely would be characterized by volatility. March proved that hypothesis to be true. For the fourth month in a row, volatility in discount rates reflected a market worried about the duration and magnitude of the current hiking cycle; however, March added in the stress within the financial sector. Recounting the last few months, year-end 2022 was marked by an increase in discount rates to over 5%, a level last approached in 2013, but not reached since August 2011. Elevated discount rates, driven by the tremendous back-up in yields, persisted through year-end. January 2023 jitters brought a decline in interest rates, which led to an over 30 bps decline in the FTSE Pension Liability Index discount rate from 5.02% to 4.69%. As the markets regained confidence that the Fed was nearing the end of its hiking cycle, rates floated back up, only to fall in March by 24 bps from 5.04% to 4.80%. The shorter duration indices (FTSE Pension Liability Index – Intermediate and Pension Liability Index – Short) fell by 27 bps and 32 bps, respectively. Duration for all the indices has fallen with the increase in rates and now stands at 17.9 years for the full index and 14 and 11 years for the Intermediate and Short indices, respectively.

Disclosures
The Callan Institute (the “Institute”) is, and will be, the sole owner and copyright holder of all material prepared or developed by the Institute. No party has the right to reproduce, revise, resell, disseminate externally, disseminate to any affiliate firms, or post on internal websites any part of any material prepared or developed by the Institute, without the Institute’s permission. Institute clients only have the right to utilize such material internally in their business.

