Callan is getting ready to prepare our 2019 Defined Contribution Trends Survey, the 12th we have conducted in its current incarnation, and we thought it would be helpful for plan sponsors to see how the industry has evolved over time. Below are some highlights from a predecessor version of the survey published in 1992 and 1998.
Survey Distribution
The 1992 DC Survey was mailed to 962 plan sponsors throughout the U.S., and 185 responded. In the “good old days,” those responses were recorded and tabulated by hand. In contrast, the 2018 survey was powered by an online survey platform and analyzed by Callan’s formidable DC Consulting Group with online tools and tech-based solutions.
In the 1992 survey, only 14% of respondents had assets greater than $1 billion, compared to the 2018 survey where the majority of respondents had plan assets above $1 billion. This is likely due in part to the evolution of the DC plan as the primary retirement vehicle and the impact of compounding over time.
Investments
A far different investment and risk landscape was represented in the 1992 survey. At that time, 49% of employers selected where company contributions were invested. And 36% of those directed the matching contributions to company stock.

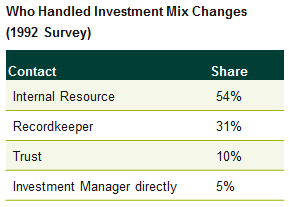
While 93% of plans in 1992 allowed participants to direct their investments, the majority of plans limited investment changes to four times a year. Slightly more than one-third of respondents had no restrictions regarding when investment changes could occur. Nowadays this question rarely arises, as daily valuation and trading is the norm.
In 1992, when employers were more likely to make or limit investment decisions for participants, the number of investment options was significantly lower, with over 90% of the respondents reporting an average of six investment choices, although many plan sponsors reported that they expected to increase that number. By 1998, the average number of investment choices in large plans had increased to eight. With advances in technology, including the wide use of daily valuation, electronic feeds, and online investment elections, that number expanded significantly to a current average of 16 funds in the Callan DC Index. The number of funds in the DC Index spiked in 2013 with an average of 26.
The presence of target date funds (TDFs) also represents a seismic shift in the DC landscape. TDFs weren’t even mentioned in the earlier surveys (and if they were, they were included under balanced funds most likely), whereas now, 91% of plans offer TDFs.
Technology
In the 1998 survey we explored the impact of new technology: the internet. Astonishingly, 61% of plan sponsors reported that they did not have access to plan data on the internet. In addition, 65% of participants did not have access to their plan information or transaction capabilities via the internet.
Our prediction at the time proved true: “Callan anticipates Internet access will increase in the near future, particularly as a way to communicate with participants.” In the most recent survey, 93% of plans report using email and the recordkeeper website to communicate plan changes, information, and benefits to participants. Other forms of communication include an intranet (64%), mobile apps (29%), social media (12%), and text messaging (4%).
Fiduciary and Risk Management
In 2018, 94% of plan sponsors indicated they had an investment policy statement (IPS). In 1998, only 63% had an IPS.
In 1998, investment decisions were made by the Treasury/Finance department in 33% of plans, and 51% of plan sponsors delegated the investment decisions to a committee. While Treasury/Finance continues to be involved in the decision-making process, by 2018 investment decisions in ERISA plans are always a committee decision.
When asked to rank criteria for evaluating or selecting recordkeepers in 1998, costs and fees ranked second compared to the No. 1 concern: timeliness of participant reports. The question was asked differently in 2018, and the outcome was distinctly different—retirement readiness ranked first, plan fees second, participant communications third. Quality of the service provider was eighth.
In 1992, 81% of plan sponsors reported managing communications in-house, and in 1998 that number had decreased to 72%. At that time a whopping 30% of plan sponsors “recordkept” the DC plan in-house.
The More Things Change, the More They Stay the Same?
In 1998 we reported that “plan fees are of growing concern with the DOL and are coming under increased scrutiny. Plan sponsors should understand what fees are paid to providers and the value of services received in exchange.” Sound familiar?


