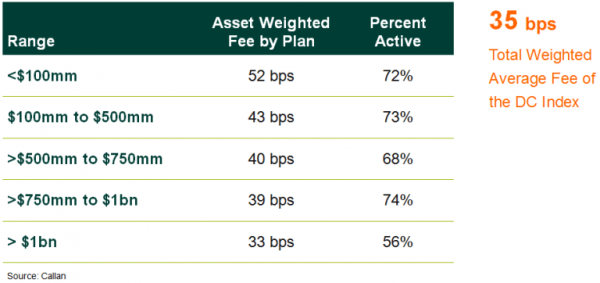
A new feature of Callan’s DC IndexTM, the DC Fee Analysis chart examines the effects of plan size, participant allocations, and vehicle utilization on investment management fees. The data can help plan sponsors compare their fees to peers and can provide guidance on how to restructure their plan options to reduce fee levels.
To calculate the average plan’s total investment management fee, we start with the asset allocation of the Callan DC Index, excluding company stock, to reflect the typical asset allocation of a defined contribution plan participant. The actual fees paid are shown according to the funds used in the plans.
Not surprisingly, asset levels markedly influenced total investment management fees paid. Mega plans have driven down their fees to an average of 33 basis points, as a result of their scale and ability to invest in institutionally structured vehicles, while smaller plans pay progressively more.

Bottom Line: Plan sponsors should periodically confirm asset minimum breakpoints and seek out new products that become available. We encourage institutional investors to explore opportunities to use lower-fee share classes or lower-cost institutional structures such as collective trusts or separate accounts.
Further Information: In addition to average fees, the Callan DC Index tracks performance, asset allocation, and cash flows of over 90 large DC plans representing approximately $150 billion in assets.


