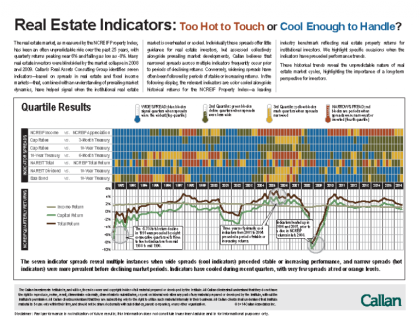
Our Real Estate Indicators, which attempt to provide insight about the commercial real estate market cycle, play a vital role in our conversations with clients and our approach to investing in this asset class.
In this edition of our Real Assets Reporter, I describe the reason we developed the indicators, the process we used, and how we incorporate them into our work.

Their creation stemmed from client conversations during the Global Financial Crisis, particularly the request of one client for a way to identify potential peril ahead in the real estate market (the GFC concentrated everyone’s minds about market risk!).
Through exhaustive research I and others at Callan determined the set of metrics that, as we put it, indicated whether the market was “too hot or cool enough to handle.”
We first published the Indicators in 2010 and have updated them quarterly since.
While the Indicators themselves are the result of robust and closely scrutinized data-crunching, we used the charticle format to make them easy to use and accessible to everyone. And they have proven quite useful in conversations with clients about their portfolios, including how and when to incorporate real estate into their allocation mix.
For more on the story behind the Indicators, as well as the latest on the quarterly real estate market, Callan’s views on the entire real assets category, and long-term tables and charts showing how real estate fits into other asset classes, click here.
7
The number of spreads we use in our Real Estate Indicators

