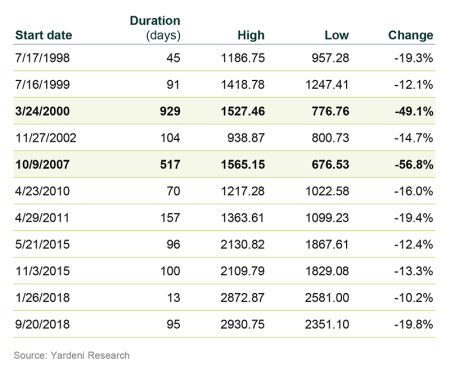
Markets continue to be roiled by the worsening news of the coronavirus outbreak around the world. The steep decline of the past week occurred more than a month after news of the virus first surfaced, as investors initially priced-in virus containment to China. But new reports of the virus spreading to 48 countries dimmed hopes for a muted market response. To put the decline into historical perspective, Callan compiled data from recent drawdowns.
Equity Markets
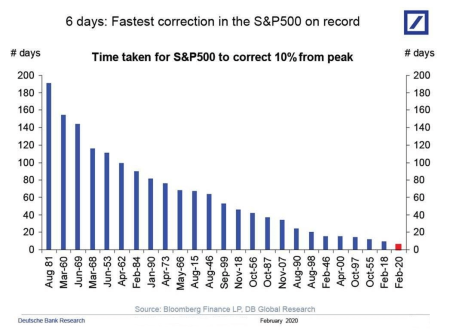
Long-term perspective is hard in volatile markets, but the S&P 500 Index is still up over the last year and by double digits over the last three years. The velocity of the current decline, however, is what worries investors most. The S&P 500 fell 12% in the five trading days this week, and had previously dropped 10% to hit correction territory in six days, the fastest plunge ever.

Equities have only declined this quickly a handful of times the past 25 years: three times during the Dot-Com Bubble (2000, 2001, 2002), during the Global Financial Crisis (2008, 2009), euro zone debt crisis (2011), and the yuan devaluation (2015).
What does this mean for equity markets going forward? Over the past 20 years, there have been 10 corrections in the S&P 500, including the current one, according to Yardeni Research. The previous correction ended in December 2018. Of those corrections, only two have turned into bear markets (defined as a decline of 20% or more from the peak).

The decline in the markets was met with a large spike in volatility, as measured by the VIX. The current spike represents the largest since the GFC.
Yield Curve
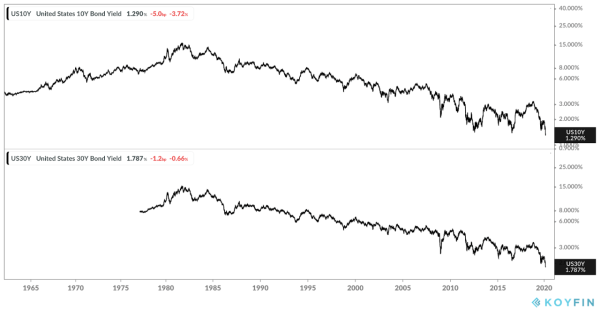
The increased uncertainty and flight for quality have driven down yields in the U.S., as investors rotate into bonds for safety. The 10-year Treasury yield touched 1.29%, while the 30-year yield is 1.79%.

What to do?
As Jack Bogle once commented in other periods of heightened volatility in the markets: “The expression is ‘don’t just stand there, do something’ and the best rule I think is ‘don’t do something, just stand there.’” While the news in the short term may get worse before it gets better, long-term perspective and patience are necessary to ride out short-term volatility in the markets.
As with other market-shaking events, this too shall pass. Over the (very) long-term, history shows us that since 1950, the S&P advances on approximately 54% of trading days, according to Crestmont Research. During that time, however, the S&P 500 has advanced 1,100 times its 1950 levels.

