Market volatility can be measured in a number of ways. We address three in the following exhibits, two historical (or experienced) and one expected (or implied).
Sizable Daily Moves
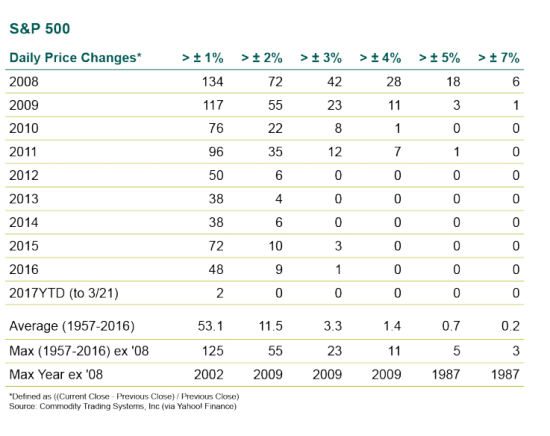
The table below shows a simple aggregation of the number of days the S&P 500 exhibited a sizable move, positive or negative, in a given calendar year. The data go back 60 years to the modern inception of the index in 1957.
Yesterday’s 1.24% decline was the first 1% move to the downside in more than 100 trading days. October 11, 2016 was the last 1% decline and coincidentally also a 1.24% loss.
Including up days, yesterday was also only the second 1% move thus far in 2017 (1.4% rise on March 1). When put in a historical context, this is an astoundingly low level of observed daily volatility. On average since 1957, more than 50 days each year experience a ±1% move on the S&P.
The table below also makes clear just how dramatic the 2008 experience was. Over 253 trading days in 2008, the S&P 500 Index moved ±1% at least every other day and ±3% almost weekly.

Historical Standard Deviation
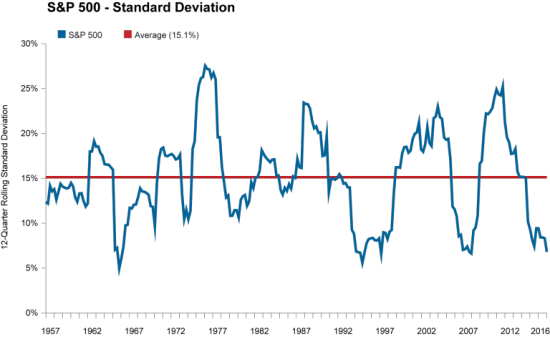
Historical standard deviation of returns is a second frequently used measure of market risk. Over the same timeframe as above, the S&P 500 has averaged 15.1% standard deviation measured quarterly on a rolling 3-year basis, albeit with substantial variance. By the end of 2016 this measure of market volatility had plunged to 6.8%, a level not seen since before the 2008 financial crisis and only experienced at two prior times over the past 60 years.

Implied Volatility
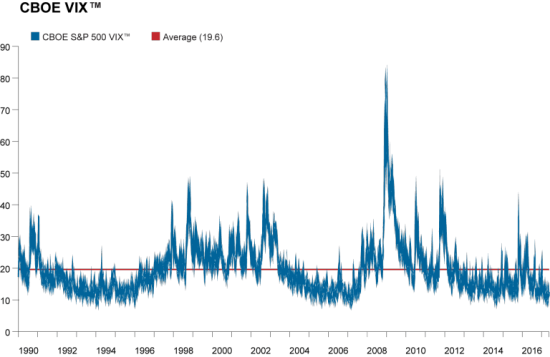
Finally, expected volatility can be derived from the market prices of index options — the oft-discussed CBOE Volatility Index® (VIX®). The VIX is frequently described as the market’s “fear gauge” as it measures the level of uncertainty implied by options values.
The measure is “unit-less,” making it useful for comparisons across assets and time horizons. The VIX has exhibited a long-term average of just under 20 dating back to the inception of data in January 1990. While “VIX” has come to be associated with the S&P 500, the Chicago Board Options Exchange now calculates VIX measures on more than 20 different indices across global equities, bonds, currencies, commodities, and time horizons.
More volatile assets such as crude oil exhibit higher levels of “VIX” (average Oil VIX is around 37) while less volatile assets exhibit lower readings (average 10-year US Treasury VIX is around 7). Generally, a higher (rising) reading for VIX represents more (increasing) expected near-term market volatility.
As with the two historical measures of volatility (daily price change and standard deviation), this forward-looking measure has been running well below its long-term average. So far, 2017 has not broken above 13 even with yesterday’s equity decline touching off a 10% spike in the reading. As markets began the day today on a quieter note, VIX is ticking back down after yesterday’s spike.

Circling back to the daily observed volatility that investors must learn to stomach: while yesterday was a notable downdraft, investors would be wise to keep a broader long-term historical context in mind before reacting to news headlines. Near-term volatility is not necessarily something to fear and may present interesting opportunities for those with longer time horizons.

