Carbon-footprinting is a method of calculating the total amount of greenhouse gas (GHG) emissions caused by an individual, organization, event, or product. By measuring their portfolios’ carbon footprint, institutional investors can benchmark where they stand on the steps for achieving their climate-related objectives.
This process also plays a key role in understanding a portfolio’s exposure to two factors, as defined by the U.N. PRI: climate risk, which refers to the decline in portfolio values resulting from both the physical risks arising from changing weather patterns, and transition risks, arising from economies becoming less carbon-intensive.
What Is Measured, and How, for Carbon-Footprinting
Greenhouse gases trap heat in the atmosphere, thereby increasing earth’s average temperature. Many scientists, including in the latest assessment from the Intergovernmental Panel on Climate Change (IPCC), attribute high degrees of confidence to catastrophic climate events in the future resulting from this increase in temperatures. The sources of greenhouse gases are varied and can range from cows excreting methane to a fossil fuel combustion process emitting carbon dioxide and many other gases.
While these gases have many different characteristics, CO2 equivalent (CO2e) is the common unit of measure that sums up the carbon emissions of different gases. The factor that converts the heat-absorbing capacity of different gases to its CO2e is called the global warming potential (GWP), a measure of how much energy (or heat) the emissions of a given amount of gas will absorb over a set period of time relative to the emissions of the same amount of carbon dioxide. The larger the GWP, the more the warming potential compared to CO2. For example, 1 ton of methane has the same warming potential as 25 tons of CO2, and 1 ton of nitrous oxide the same as 300 tons. Detailed CO2 equivalent values of different greenhouse gases can be obtained from multiple public sources.
The Scope of Scopes
The nonprofit Greenhouse Gas Protocol has developed the most comprehensive and widely used framework for GHG emissions accounting and reporting. This framework classifies emissions into three scopes:
- Scope 1: direct emissions owned and controlled by the reporting entity
Examples include owned energy generation and owned vehicles. - Scope 2: indirect emissions, including those from purchased electricity, steam, heating, and cooling
The reporting entity does not own/control the facilities that generate/provide these. - Scope 3: indirect emissions that occur in the value chain
Examples include employee commuting, business travel, and emissions attributable to suppliers (upstream emissions) and distributors (downstream emissions).
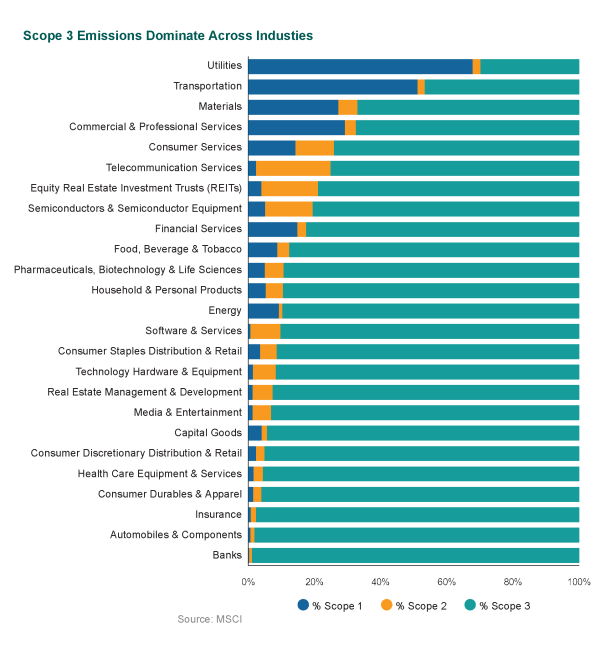
GHG emissions vary by industry with energy, utilities, materials, and automobiles having significantly higher emissions than those from the software and insurance industries, for example. To further complicate matters, Scope 3 emissions for one reporting entity can be Scope 1 and 2 emissions of another reporting entity that is the part of the first entity’s value chain (e.g., a supplier or distributor). Additionally, as the accompanying chart shows, Scope 3 emissions dominate total emissions.

Reporting Challenges
GHG emissions reporting has improved over time, particularly in the developed markets, but challenges remain in the absence of any standardized guidelines. Based on an analysis conducted by MSCI, a leading emissions reporting firm, 75% of the constituents of the MSCI World Index (U.S. and other developed markets’ large and mid-capitalization companies) report Scope 1 and Scope 2 emissions, and 63% report Scope 3 emissions. Fewer than 40% of the constituents of the MSCI ACWI IMI Index (developed and emerging markets for companies of all capitalization sizes—the broadest global index) report Scope 1 and Scope 2 emissions, and only 25% report Scope 3 emissions. Larger capitalization and developed market companies are much more likely to report emissions than their smaller capitalization and emerging market peers.
Moreover, there is the issue of consistency in the reported data. Companies voluntarily report their emissions data across multiple channels—they may release the emissions data in what is commonly referred to as a “sustainability report,” in their annual report, or on their websites, or provide it to a third-party data aggregator like CDP, which runs a global environmental disclosure system and is used by many emissions data providers. In the U.S., large emitters must report their emissions data to the Environmental Protection Agency as well.
The first data challenge is the mismatch in the reported values across different channels (e.g., a company reports one metric in its sustainability report but a different figure to the CDP). Emissions data providers must undertake checks to reconcile these discrepancies. Additionally, to improve coverage, emissions data providers must use model-based estimates to fill in the gaps, particularly with Scope 3 emissions. The Securities and Exchange Commission is considering a climate risk disclosure proposal that, if adopted, will require companies to disclose audited Scope 1 and Scope 2 emissions. It will also require disclosure of Scope 3 emissions, if they are material to the reporting company’s operations. Meanwhile, California recently signed into law Senate Bill 253, the Climate Corporate Data Accountability Act. Once operational, the law will require public and private companies above a certain size that are doing business in California to report annually their Scope 1, 2, and 3 emissions.
The second data challenge is that of double counting. What is Scope 1 for one company in the portfolio can be Scope 2 for another company in the same portfolio, and Scope 3 for a third. Currently, there is no available mechanism to “net” these out. However, this double counting should not be a major issue when comparing a portfolio’s carbon footprint to its benchmark because the same double counting will happen to both the portfolio and the benchmark.
Two Fundamental Questions
The primary reason for an investor to conduct carbon-footprinting of its portfolio is to address two fundamental questions:
- What am I responsible for?
- What is my exposure?
The responsibility aspect captures the emissions owned by the investors. If the investor owns x% of the company, then it is responsible for x% of that company’s emissions. The exposure dimension captures the investor’s exposure to the regulatory and transition risk that is embedded in the constituents of the portfolio being evaluated.
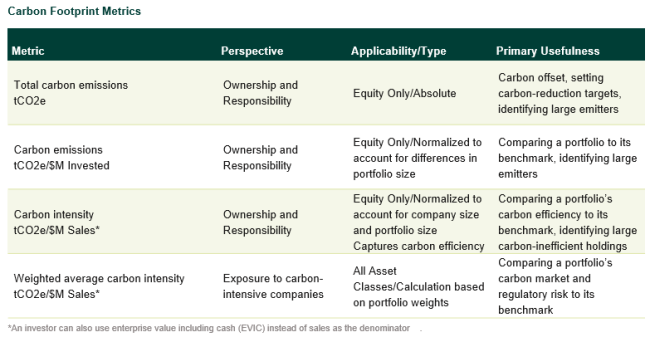
The following table summarizes four carbon footprint metrics that can be useful to an investor. As the table highlights, each of these metrics provides a unique perspective for evaluating carbon emissions. It is incumbent upon the investor to evaluate which of these metrics (alone or in a combination) is relevant to its situation.

Carbon Footprint Analytics
Considering the data challenge associated with Scope 3 emissions, investors are currently undertaking carbon-footprinting of their portfolios using Scope 1 and 2 emissions. But as Scope 3 emissions data availability improves in the future, this should be incorporated as well.
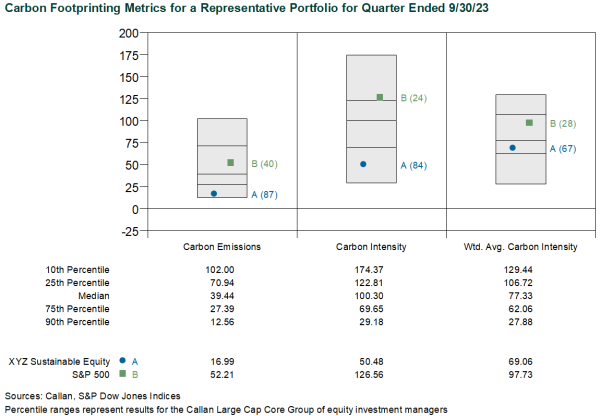
Carbon-footprinting can be done at the total portfolio level, at the asset class level, or at the individual strategy level. The accompanying chart showcases a use of carbon footprint metrics. The chart shows the carbon emissions, carbon intensity, and weighted carbon intensity metrics for an investment strategy that incorporates ESG principles into its investment philosophy. The chart shows the portfolio’s Scope 1 and 2 emissions and compares them to its relevant peer group and benchmark. One can see that through active security selection, the investment manager has been able to significantly lower its carbon footprint. While not shown here, one can also do a deep dive at the sector level to see what sectors are driving the portfolio’s carbon footprint, and then within each sector, what specific securities are the largest contributors/detractors. The investor can also group all the investment strategies to create similar analysis at the asset class level. Additionally, one can plot a time-series to observe directional changes.

The Heat Is On!
While the science of emissions has a long history of observation, measurement, and interpretation, the same cannot be said for company-level reporting and portfolio-level evaluation. Measuring and reporting carbon emissions is an evolving field whose future is dependent on the regulatory framework, which itself is evolving. Data availability and applicability also vary widely by asset class, and existing and available data has challenges. Public equities are the most evolved followed by fixed income, and challenges are much greater in other asset classes.
But this should not stop institutional investors that are pursuing climate change goals from getting started. With increasingly higher global surface temperatures and wildfires observed in recent times, the heat is on. Actions that investors can take in response to their portfolios’ carbon footprint range from portfolio evaluation and implementation choices, to individual and collective engagement with companies and industry collaboration, to divestment in extreme situations. At the same time, it is prudent to understand the limitations inherent in carbon measurement and reporting and also the carbon footprint metrics being used.
Disclosures
The Callan Institute (the “Institute”) is, and will be, the sole owner and copyright holder of all material prepared or developed by the Institute. No party has the right to reproduce, revise, resell, disseminate externally, disseminate to any affiliate firms, or post on internal websites any part of any material prepared or developed by the Institute, without the Institute’s permission. Institute clients only have the right to utilize such material internally in their business.

