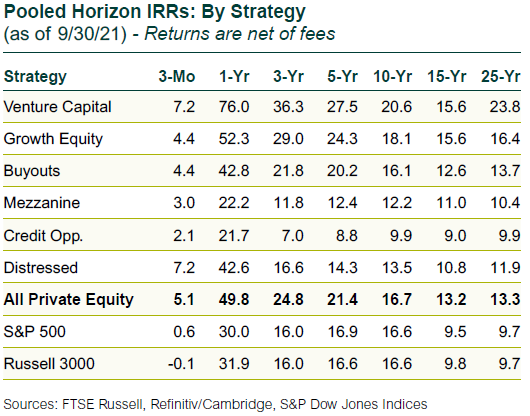
Private equity has adapted well to the COVID environment, with tremendous growth last year. On average, year-over-year transaction activity rose by 30% and dollar volumes by 70%, not terribly surprising given the effects of the bear market in early 2020, but on a standalone basis industry growth is still unprecedented. Trailing 12-month returns through 3Q21 show private equity outperformance of 1,800 bps over public equity. These strong returns continue to attract new investors and major commitments to the asset class.

Fundraising: More, Faster
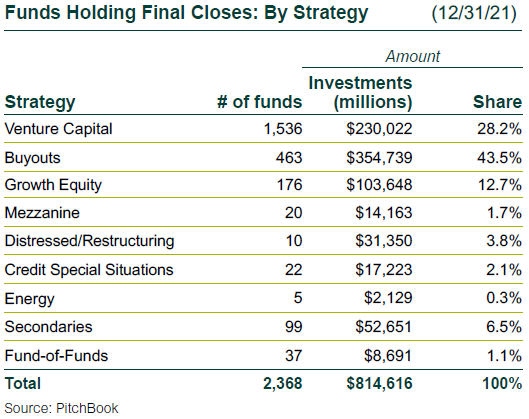
- Based on preliminary numbers, in 2021 private equity partnerships holding final closes raised $815 billion globally across 2,368 partnerships (unless otherwise noted, all data is provided by PitchBook and 4Q numbers are very preliminary). The dollar amount is only 5% away from 2020’s total, and the number of funds trails by 22%; both will exceed 2020 after final tallies.
- 4Q21 final closes totaled $162 billion, based on data so far, up 5% from 3Q. The number of funds totaled 479, down 6%.
- General partners (GPs) are returning to market with new and larger funds earlier than in the past. For sought-after GPs, due diligence timeframes are contracting.
Buyout Investments: GPs Deploy Capital Rapidly
- New buyout investments for 2021 totaled 12,410, up 32% from 2020. Dollar volume increased 52% to $797 billion. The deal environment is exceptionally active and most GPs are deploying funds very quickly—within two to three years.
- Deal count has been relatively steady at just over 3,000 for the past five quarters. The fourth quarter saw new investments at 3,022, a 1% decrease from 3Q. Announced dollar volume has been more varied—4Q at $204 billion was the second strongest of 2021, but it was down 20% from 3Q.
- Business products and services at 29% of disclosed value outpaced the next largest sector, technology (21%).
Prices Still High
- Average buyout prices for 2021 were 12.8x EBITDA, unchanged from 2020.
- However, average equity contributions fell from 55% of capital structures to a less conservative 49% in 2021.
- Following caution brought on by the downdraft in 2020, market liquidity and ample availability of debt and equity capital is fostering a more “risk-on” environment.
- There is growing awareness that prices are extremely high by historical measures. Many GPs state that price-multiple contraction scenarios are gaining additional emphasis in their buyout analyses.
VC Investments: Late-Stage Continues to Drive Volume
- The year produced 45,665 rounds of new investment in venture capital (VC) companies, up 13% from 2020. Announced volume of $710 billion was up a stunning 99%. Dollar volume increased in each quarter, while deal count declined, indicating a rising price environment.
- 4Q saw an 11% decline in new rounds to 10,196, but dollar volume rose 11% to $204 billion—a new high point in recent years.
- The 172 financings of unicorns (VC companies with valuations of over $1 billion) moderated from the prior quarter’s 191, but 4Q dollar volume of $73 billion was a $13 billion increase over 3Q and represented 36% of VC capital deployed.
- The median pre-money valuations of Seed through Series D rounds continued to increase during 2021, with pricing across rounds increasing an average of 36% for the year.
PE-Backed M&A Exits: Strong Jump Over 2020
- Last year saw 3,001 buyout-backed private M&A exits, up 31% from 2020, with proceeds of $692 billion, up 66%. The increased volatility in 2H21 public market prices seemed to impact exit counts, but not dollar volume.
- 4Q exits of 755 were down 3% from 3Q, and proceeds of $188 billion were down 11%, but 4Q was the second strongest of the year and showed impressive volume.
PE-Backed IPOs: Great Year but With a Weaker Finish
- It was a good year for raising IPO capital across all genres. The year’s 427 buyout-backed IPOs increased 150% from 2020, with proceeds of $132 billion, up 76%.
- 4Q buyout-backed IPOs numbered 112, unchanged from 3Q, but proceeds of $27 billion declined 16%.
- A factor affecting 4Q is that IPO after-market prices started plunging in November 2021, even as the S&P 500 continued to rise, which chilled the market for both VC- and buyout-backed offerings toward year-end.
- There were no notably large 4Q offerings driving volume, with $2.6 billion for Nordic consumer eyeglass and optics retailer Synsam topping the list.
Venture-Backed M&A Exits: Increased Sales Volumes
- VC private exits provided significantly more liquidity than in the last two years. Exit count was up 40% to 3,080 from 2020, and announced value jumped 63% to $218 billion.
- The fourth quarter saw a dip from 3Q, likely due to the increase in general equity market volatility and specifically IPO valuations, with count of 739 down 10% and announced proceeds of $48 billion falling 24%.
Venture-Backed IPOs: Mixed Messages
- The year saw 636 venture-backed IPOs, up 49% from 2020, valued at $201 billion, up 179%—a very strong showing. The first two quarters drove much of the volume, with the more volatile third and fourth quarters affecting the amount of the issuance more than the number of offerings. The year averaged 1.7 VC-backed offerings per day.
- Following a 3Q dip, VC-backed IPOs rose 16% to 162 in 4Q, and new issuance increased 18% to $39 billion.
- Electric SUV and pickup maker Rivian’s $11.9 billion IPO was the quarter’s largest by far, accounting for 28% of the total. However, 2Q’s $37.7 billion Coinbase IPO took top honors for the year.

Private Equity Returns: Tremendous Gains
- The last 12 months ended 3Q21 saw an enormous rise in private equity returns, with voluminous distributions but even stronger unrealized appreciation.
- Private equity bested public equity for the 12-month period by about 1,800 basis points.
- Much of the gains occurred through public offerings, but private valuations also increased notably. A key question is how quickly the gains will be distributed to limited partners.
- In 3Q public markets took a round trip, up about 8% at one point but ending nearly flat. In contrast the private equity index was up 5.1% in 3Q.
- The Refinitiv/Cambridge private equity database outperformed broad public equity indices over all horizons.
