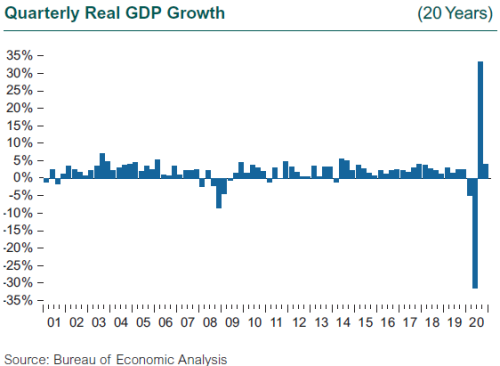
The U.S. economy grew at a 4% rate in the fourth quarter of 2020 but finished the year with a 3.5% decline in GDP compared to 2019, the steepest recession in 75(!) years. The plunge in economic activity in 2Q and the sharp rebound in 3Q put into question the reliability of economic data, and GDP in particular, in telling the tale of the true economic impact of the pandemic. The way countries measure GDP varies, especially when it comes to the output of the government sector. Reported GDP plunged in the U.K. far more than in continental Europe or the U.S., but the difference had to do with the valuation of the change in government output. In the U.S., we value government output in large part by looking at how much is spent on government services. Teachers, civil servants, and public health care workers were still paid, even though their activities were severely altered, so government output changed little. In the U.K. and France, data such as the number of hospital procedures, doctor’s visits, and pupils in school are used, and this activity fell sharply. Did economic activity really fall farther in the U.K., or are the data not telling the full story?
The labor market data also seem to reveal a tale of two cities—or do they? The difference in the benefits offered by different countries to those dislocated by the pandemic are substantial, and seriously bias economic measures such as the number of people employed and unemployment rates. In many euro zone countries, pandemic relief came in the form of subsidies to companies to keep their employees on the payroll. In the U.S., companies furloughed or let go of employees, and the states and federal government used the unemployment benefits system along with direct grants to households via stimulus payments to support these dislocated workers. As a result, unemployment in the U.S. spiked to almost 15% in April, while the unemployment rate in many euro zone countries barely moved. Another complication is that the unemployment rate in the U.S. suggests more slack than there may be in practice. A clue to this mismatch in the data between unemployment and potential capacity is in the data tracking those seeking work. In the U.S., the number seeking jobs usually tracks the unemployment rate very closely. During the pandemic, the number of job seekers barely increased while the unemployment rate quadrupled, suggesting workers are expecting to be rehired into their former jobs or in their former industry.

This focus on the labor market is important for clues as to how the economy will recover and who has been the most affected by the pandemic-induced recession. Since consumption is 70% of GDP in the U.S., the direct tie between employment and income and then spending is vital; that tie has been blurred by the massive stimulus provided both here and in our trading partners. Stimulus payments directly to industries and individuals, as well as expanded unemployment benefits, have buoyed spending both by consumers within countries and on our traded goods between countries, and prevented an even steeper economic decline than this worst-in-seven-decades experience. Total employment in the U.S. fell by 22 million between January and April, and we have generated 12 million jobs since April to replace them. The problem for the continued recovery is that we are still short millions of jobs, and the rate of job recovery plateaued in October 2020 and remained flat through December.
Employment loss by industry has been wildly variable, and points up just how different the economic impact has been from the stock market’s incredible recovery. The sectors that drove the stock market rebound since March—information technology, communications, the sectors of consumer goods and wholesale/retail trade driven by Amazon—suffered little if any employment decline, and in fact employ far fewer people than the sectors that are underrepresented in the stock market and suffered the biggest job losses. Employment in leisure and hospitality fell by 8.2 million during March and April, increased by 4.9 million from May to November, and then declined by over half a million in December as stricter shelter-in-place rules were reinstated prior to the holiday season in many states. Since February 2020, employment in leisure and hospitality is down by 3.9 million, or 22.9 percent. The other big losses were in state and local government, services, manufacturing, and education. These sectors employ many lower-paid, lower-skilled, and part-time workers and often feature a high concentration of female employees. Income inequality during the pandemic has been exacerbated as a result.
The path to recovery in the U.S. and most developed economies will likely see the level of GDP regain its pre-pandemic peak in mid-2021, but the job markets are not likely to regain their pre-pandemic job counts until well into 2022, restraining consumer spending and the overall global recovery.

