This blog post from Callan’s Private Equity Consulting Group provides a high-level summary of private equity activity through all the investment stages, from fundraising to exits, as well as performance data across a range of market cycles. (Investment-stage data provided by PitchBook; performance data from Refinitiv/Cambridge.)
Fundraising: Onward and Upward
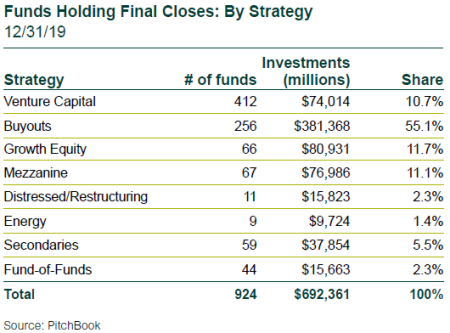
- Private equity global fundraising has surpassed 2007’s famed peak of $615 billion for two straight years, hitting $692 billion in 2019.
- As expected, fewer-but-larger funds collected more commitments, as significant increases in follow-on fund sizes were ubiquitous (and bedeviling to limited partners). Funds holding final closes during the year totaled 924, down 1% from 2018, but commitments increased by 5%.
- While investors continue to focus on strategy diversification, buyout funds jumped to 55% of commitments in 2019 from 40% in 2018.
- Mezzanine debt saw the only other increase, up 2 percentage points in share; growth equity’s share fell the most, by 10 points.
- In 2019, U.S. funds received 64% of global commitments, Europe 22%, Asia 11%, and the rest of the world 3%.

Buyout Investments: Down but Still Brisk
- Buyout prices continued to increase in the fourth quarter, affecting transaction volume for both the quarter and the year.
- The year’s total investment count and dollar volume are notably lower than in 2018, with declines of 15% and 24% to 7,555 and $552 billion, respectively.
- Industry press frequently highlights potential concerns about increasing commitments but slowing investment activity in private equity’s dominant buyouts sector, which results in a growing “overhang” of uncalled commitments. For Callan clients, we are observing that current portfolio investment rates would deplete existing uncalled commitments in a three- to four-year period—well within the five- to six-year investment period of most partnerships. However, this will vary across individual partnerships.
- Average buyout prices hit a record of 11.4x EBITDA, compared to 10.6x in both 2017 and 2018.
- The average equity going into deals ticked up to 5.6x, compared to 4.8x in 2018. Average debt financing for 2019 is unchanged from 2018’s 5.8x level.
- While average debt levels are now slightly higher than just prior to the previous, pre-GFC peak, they have held steady for two years, and general partners are using more equity to stretch for increased prices.
Venture Capital Investments: Sustained Modest Slowdown
- The number of venture capital (VC) investment rounds in 2019 fell by 12% to 28,868, and the announced dollar volume declined 13% to $258 billion. The fourth quarter was the year’s weakest.
- Unicorn financings fell from 39 in the third quarter to 31 in the fourth. The issues with WeWork and Softbank’s Vision fund likely induced caution at the larger end of the VC market.
- Many of the large VC companies in the “private-for-longer” segment are rotating from “blitzscaling” to seeking profitability, a significant reversal—and success is yet to be determined.
- Median pre-money valuations continued to rise throughout 2019, with the largest increase being Series C, up 30% from 2018. The one exception was Series D, which fell 0.5% below its 2018 level.
Private Equity-Backed M&A Exits: A Pause
- Private equity-backed M&A exits for the year fell by 12% to 2,054, and dollar volume declined 13% to $608 billion.
- Exit activity in 2019 based on announced dollar volume had been trending up steeply for three quarters from a low base due to the impact of the volatile final quarter of 2018. While the fourth quarter slowed, it remained significantly larger than the first two quarters of the year, which lends some comfort regarding continuing strong future liquidity.
Private Equity-Backed M&A IPOs: Tough Audience
- The year’s 95 buyout-backed IPOs plunged 41% from 2018, with proceeds of $30 billion, down 32%.
- Choppy public equity markets and recent travails for certain venture-backed companies (Uber, Lyft, and the pulled WeWorks IPO) are likely dampening receptivity to new offerings in general.
Venture-Backed M&A Exits: Strong 1st Quarter; Respectable Year
- Venture-backed M&A exits for the year totaled 1,554, down 8% from 2018. Announced dollar volume of $122 billion was down 13%.
- All in all it was a respectable year versus recent history, supported by a notably strong first quarter. A dollar volume bump in the fourth quarter was positive, indicating fewer but larger companies were sold.
Venture-Backed IPOs: ‘Unicorn Stampede’ Fizzles Out
- The year’s 209 venture-backed IPOs fell 5% from 2018, with proceeds of $42 billion, down 9%.
- The excitement about many of the unicorns finally going public has abated after disappointing market results for some of the highest-profile companies.
- Airbnb is probably the most anticipated debut in 2020, but it may be a direct listing rather than a traditional underwriting. Spotify and Slack have been the most recent direct listings and have had mixed after-IPO results.

Returns: Private Equity Outperforms Choppy Public Markets
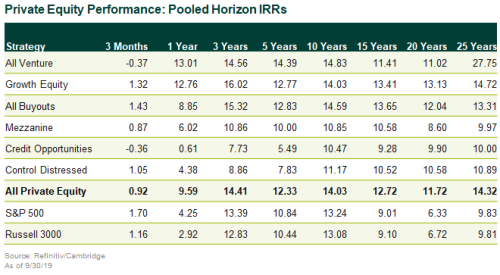
- For the 12 months ended Sept. 30, 2019, private equity strongly outperformed public equity with the Refinitiv/Cambridge Index up 9.6%, versus 2.9% for the Russell 3000. Private equity was less influenced by the brutal public equity market downturn in the fourth quarter of 2018, a drag on the 12-month return for the public indices.
- The Refinitiv/Cambridge private equity database outperformed broad public equity indices over all horizons of one year or more.
