Capital markets abhor uncertainty, and we have seen nothing but uncertainty this year. The Russian invasion of Ukraine threw expectations for an orderly transition from the pandemic era out the window. Kinks in supply chains were expected to be smoothed, energy prices and inflation in general were projected to calm and subside after surging in 2021, and market participants anticipated an orderly transition from zero interest rate policy to a more “normal” yield curve. All these were key components to a consensus view that U.S. and global economies, and their capital markets, would slow gradually toward trend growth and reach the proverbial “Goldilocks” scenario: not too hot, not too cold. Like a soft landing for the Fed, the Goldilocks scenario is aspirational and has never really been achieved.
Instead, inflation is burning out of control. Global energy markets are surging and volatile. Geopolitical uncertainty is moving toward a level some experts liken to the period after World War II, when the United States and the Soviet Union were trying to figure out a new world order. This time, China represents a third axis of power with another agenda. Stock and bond markets around the globe are down together for three quarters in a row through September 2022. The S&P 500 plunged 24% year-to-date, and developed and emerging market equities are down a similar amount, punished by the strong dollar. While painful, such a drawdown in the equity markets is expected periodically. What is not expected is the 14.6% loss in the bond market (Bloomberg Aggregate) at the same time. The nine-month returns for the Aggregate are the worst in its history. There is no place to hide for a diversified portfolio.
The losses in both the bond and stock markets this year are primarily due to the sharp rise in interest rates. The lack of any yield cushion at the start of 2022 makes the rise in rates particularly painful for bonds. Rates have risen this much in the past, but the last time was during the regime change for monetary policy in the early 1980s. The giant capital losses were cushioned by yields as high as 14%. We began this year with the yield on the Aggregate at 1.75%; by Sept. 30, it reached 4.75%. With a duration of over six years for the Aggregate, the capital loss implied by such a rate rise is close to 20%. The rising yield collected offsets some of this capital loss.

The Fed announced plans to raise rates aggressively in 2022, targeting a Fed Funds rate of 3.25% to 3.5% by December, but the market didn’t really believe it until the Russian invasion in February. Then investors fully priced in the Fed’s plans all at once. During the long period of zero interest rate policy over the past decade, we often mused that the best way to return to normal in the bond market would be to rip the “low-rate bandage” off and move at once to the new normal. Get the pain over with, absorb the capital loss, and start collecting the higher yield. Be careful what you wish for.
Still, U.S. Economy Stays Healthy
Underneath this mayhem in the capital markets, the U.S. economy has been strong, with a particularly robust job market and healthy consumer spending. The economy added 263,000 jobs in September, down from the torrid pace set earlier this year, but for the quarter nonfarm employment increased by more than 1.1 million jobs. Even more importantly, we finally reached the pre-pandemic level for total employment in August 2022. Personal income growth has recovered from the withdrawal of pandemic support (transfer payments), rising 5.9% in 2Q and 5.5% in 3Q. Disposable income (after tax) rose by similar rates. However, inflation has taken a toll this year; real disposable income is 4% to 5% lower than the same month one year ago starting in May 2022, while real consumption expenditures are 6% to 7% higher.
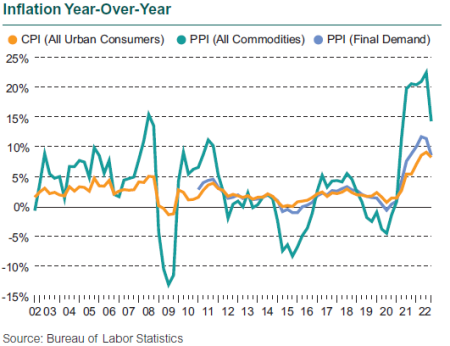
Inflation reports continue to scare. CPI-U, known as headline inflation, it is still up 8.2% year-over-year through September. The energy component is up 19.8%, food is up 11.2%. Core CPI, which removes the volatile food and energy sectors, is up 6.6%. This 12-month rise in core CPI is the highest since 1982. The only good news is that after hitting 9.1% year-over-year in June, month-to-month changes in the CPI are essentially flat in July, August, and September. The year-over-year changes are influenced by the base effect, as prices really began to rise in early 2021, but were still depressed.

The Fed’s preferred measure of inflation, PCE, is up 6.2% through September, and core PCE is up 5.1%, both year-over-year measures. Both measures of PCE have flattened month-to-month since early summer.
These levels—8.2% for CPI-U and 6.2% for PCE—mean pain for individual consumers’ budgets and for business and government operations. But all economic data are subject to multiple interpretations, and in this case, as we search for clues on the direction of inflation, the fact that the month-to-month changes have flattened is at least the potential start to a deceleration in prices. The problem with inflation, which is a rate, unlike employment, which is a stock (number of people working), is that even if the rate of inflation goes to zero, prices remain at their higher level. The price of gas may stop going up, but it’s now stuck at a level that is double that of just a couple of years ago.
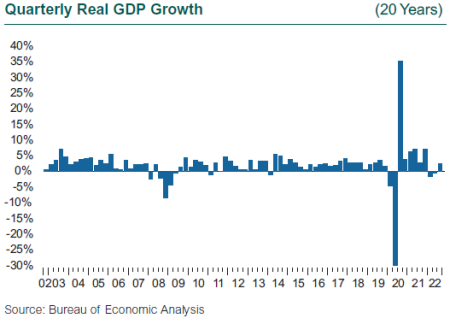
Traditional measures of economic health are still out of whack as they often were during the pandemic. GDP is the biggest puzzle so far this year. GDP fell 1.6% in 1Q and another 0.6% in 2Q, while at the same time we generated more than 2 million new jobs. The GDP declines were deemed to be anomalies driven by inventory swings and net exports, not underlying economic weakness. Third quarter GDP grew by 2.6%, with strong contributions from exports, business fixed investment (equipment and intellectual property), and a resumption of government spending. However, fourth quarter GDP is now projected to fall. After all the mayhem, GDP growth will likely end up being positive in 2022—but it is projected to be negative in 2023, signaling more challenges ahead and the potential for a recession to extend through 2Q23.
Disclosures
Certain information herein has been compiled by Callan and is based on information provided by a variety of sources believed to be reliable for which Callan has not necessarily verified the accuracy or completeness of or updated. This report is for informational purposes only and should not be construed as legal or tax advice on any matter. Any investment decision you make on the basis of this report is your sole responsibility. You should consult with legal and tax advisers before applying any of this information to your particular situation. Reference in this report to any product, service, or entity should not be construed as a recommendation, approval, affiliation, or endorsement of such product, service, or entity by Callan. Past performance is no guarantee of future results. This report may consist of statements of opinion, which are made as of the date they are expressed and are not statements of fact. The Callan Institute (the “Institute”) is, and will be, the sole owner and copyright holder of all material prepared or developed by the Institute. No party has the right to reproduce, revise, resell, disseminate externally, disseminate to subsidiaries or parents, or post on internal web sites any part of any material prepared or developed by the Institute, without the Institute’s permission. Institute clients only have the right to utilize such material internally in their business.

