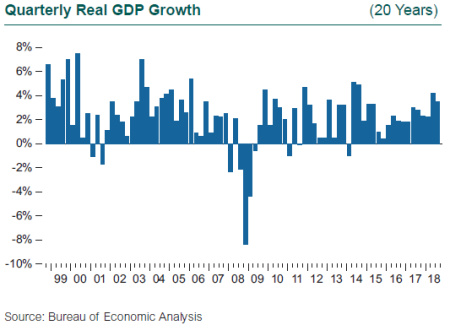
September 20 marked the capstone of a summer run-up in the U.S. equity market. We saw a true market correction in February (S&P 500 Index down 10.1%) and a drawdown of more than 7% in March, but the memory of those experiences was obliterated by a smooth, steady climb, with the S&P 500 gaining 12% in the first three quarters. Economic reports came in mixed for most economies outside the U.S. during 2018, but the U.S. economy has been firing on all cylinders, with the job market, investment, and output all showing robust gains. GDP grew 3.5% in the third quarter and 4.2% in the second. The accompanying run-up in the equity market buoyed confidence that all was not just well, but great, and this economic expansion and bull market still had fresh legs to keep going.
If only we knew in September what Halloween fright awaited us in October.
Since the start of the year, investors had been growing increasingly concerned that the expansion was getting long in the tooth, and that both the economy and the stock market must be nearing peaks. While elapsed time is not an economic variable, the current expansion setting a record for length heightened fears of a downturn. Richly priced capital markets across all asset classes and a new peak in the level of corporate earnings reported during the summer earnings season suggested that a market correction was inevitable.
Through the end of September, such fears contrasted with the continuing stream of good economic news, and the market roared. The unemployment rate dropped to 3.7% in September, the lowest since 2000. Wages continue to inch up, with average hourly earnings growth rising from 2% toward 3%. While potentially inflationary and certainly a cost to business, stronger wage growth kept consumer spending robust, and boosted consumer (and business) confidence.

Against this backdrop, the Fed raised rates three times in 2018, bringing the Fed Funds rate to 2.0-2.25%. The Fed expects one more rate hike this year and three in 2019. The Fed has now raised rates 200 basis points over the past two years. Since inflation has not changed over this period, real rates have essentially risen by 2 percentage points. Much of the growth in the first half of 2018 was attributed to the tax cut and spending, and trade activity in advance of tariffs imposed in July by the U.S. and China. Monetary policy has incrementally become a more significant headwind, and it began showing up in the third quarter.
While it is true that real rates are low relative to history, the change in rates is important. Since the mid-1980s real rates have risen by 2 percentage points four times; three of those occurrences resulted in recessions. In a study by Capital Economics, monetary policy tightening was a major contributing factor in 29 out of 45 recessions in G7 countries since 1960.
Higher interest rates are beginning to squeeze some of the most rate-sensitive segments of the economy. Housing has been an ongoing mystery; starts surged to an 11-year high in May, only to stall during the summer. Home sales are also clearly feeling the pressure of higher rates, and from the supply side, a shortage of houses. Residential investment contracted by 4% in the third quarter, following declines in each of the first two quarters. Home prices rose substantially in certain markets through the summer, but early indications are that rates began to crimp prices and sales in September. Housing can often be the canary in the coal mine: an early indicator of slowing economic activity and lower confidence.
Inflation had been gradually trending up, reaching 2.9% in June, finally fulfilling the expectations of many market observers, but the year-over-year gain in the CPI slowed to 2.3% in the third quarter. Much of the rise in the first half was attributable to a rebound in oil prices. Once oil prices stabilize as expected, the increase in inflation will likely abate. One reason for the stability of inflation is the growing dominance of services in the inflation calculation. The services inflation rate has been much steadier than the goods rate and consistently positive near 2%. Goods prices are more volatile and much more influenced than services by factors such as trade, currency, supply and demand of raw materials, and geopolitics.
Related to goods prices, the ISM manufacturing index had reached a 14-year high earlier this year, but fell back in September, as manufacturers and exporters face the triple threat of a stronger dollar (up 8% since mid-April), the imposition of tariffs in July and anticipation of more in October, and weakening of global growth.

