With volatility extremely low and the global economy humming along, equity markets around the world continued their steady march upward in the third quarter, part of what has been dubbed the “everything rally” as bonds and commodities have also done well. Even cash is up from its dismal 0% days and posted a +0.3% quarterly result.
U.S. Stocks: Hitting New Highs
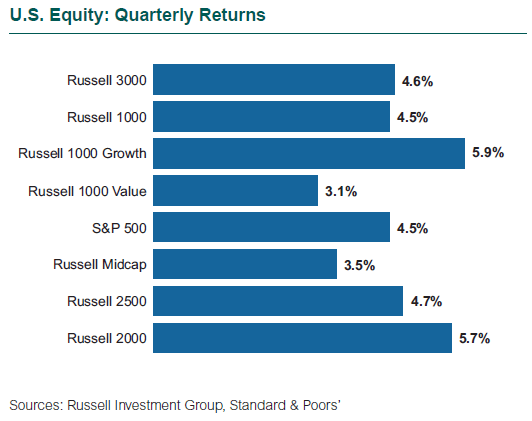
The Goldilocks environment (“Not too hot, not too cold, but just right”) and investor complacency continued to propel U.S. stock markets to new highs, in spite of escalating tensions with North Korea, several severe natural disasters, and uncertainty around the prospects for tax reform and other U.S. domestic agenda items. The S&P 500, Russell 2000, and Nasdaq Composite indices all hit record highs on the final trading day of the quarter. It was the Nasdaq’s 50th record close this year.

Investors’ attention remained focused on the hopeful promise of tax reform along with the generally upbeat picture of the U.S. economy. But contrarians question where longer-term alpha can be found amid stretched equity valuations.
The Tech (+8.6%) and Energy (+6.8%) sectors led the S&P 500 (+4.5%). The globally dominant “FAAMG” stocks (Facebook, Amazon, Apple, Microsoft, and Google) continued to drive results in the Tech sector, which now accounts for 23% of the S&P 500 and 38% of the Russell 1000 Growth Index. Tech alone has contributed approximately 40% of the S&P 500’s return year-to-date, with key drivers being strong earnings reports, increasing market share, and product innovation. But record-high valuations for several Tech companies raised concern over their influence on the overall performance of the index should a correction occur.
The Energy sector continued to see signs of incremental improvement during the quarter due to a backdrop of improving supply and demand. Consumer Staples (-1.3%) was the sole sector to fall as momentum-oriented stocks and sectors garnered favor.
Small cap stocks outperformed large cap. In addition, growth outperformed value (Russell 1000 Growth: +5.9% vs. Russell 1000 Value: +3.1%; Russell 2000 Growth: +6.2% vs. Russell 2000 Value: +5.1%). Biotech (+14.5%) and a surge in small cap value on tax reform news in September bolstered small cap stocks during the quarter. Biotech benefited from the easing of pricing risks as well as the FDA’s approval of genetics-based therapeutics.
From a factor perspective, momentum (+27.5% YTD) remained the top performer while defensive (+8.5% YTD) was the laggard. Stock-buying behavior has had a meaningful influence on results as investors tend to project their optimism across the broad market and chase momentum during periods of strength.
Global Stocks: Stronger Outside the U.S.
Non-U.S. developed economies continued to gain traction. Second quarter GDP growth in the euro zone was 2.3% (year-over-year) with consumer confidence and demand both showing strength. The euro gained ground versus the U.S. dollar, and the pound continued to strengthen on hawkish comments from the Bank of England. Outside of Europe, Japan’s economy continued to slowly recover; second quarter GDP growth was 2.5% (annualized). While this was lower than expected, the country’s economy has now expanded for six consecutive quarters.

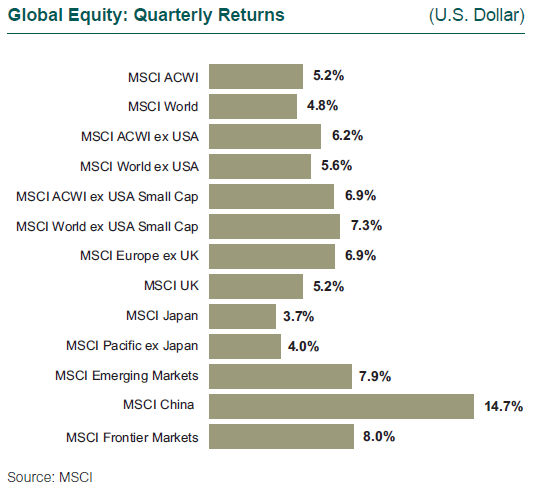
Non-U.S. developed equity (MSCI World ex USA: +5.6%) outperformed U.S. equity for the third consecutive quarter as the European market (MSCI Europe: +6.5%) continued to post positive economic data and corporate earnings growth with some signs of political stability.
The dollar’s losses against the euro stemmed from an upside surprise with European growth and market-friendly outcomes in European elections. Economically sensitive sectors outperformed defensive securities.
All sectors generated positive returns. Energy and Materials were the top two performers as a result of higher oil and commodity prices. WTI and Brent prices surged by 12% and 20%, respectively, driven by favorable supply and demand dynamics. Copper rallied 9% due to tightening supply and positive economic data from China.
Value outpaced growth as economically sensitive sectors posted strong quarterly results.
Emerging Markets: Upbeat Signs Across the Board
Emerging markets topped developed markets for the third consecutive quarter, fueled by a soft dollar, synchronized global growth, and strong oil and commodity prices. Brazil was the best-performing country within emerging markets given the hope of achieving fiscal reforms to spur economic growth. China continued to fare well with GDP of 6.9% exceeding expectations; the Chinese Tech and Real Estate sectors were top performers.
All sectors within emerging markets posted positive returns, led by economically sensitive ones such as Real Estate, Energy, Materials, and Financials.
Brazilian and Russian banks surged during the quarter, spurred by rising oil and commodity prices and improving lending conditions.
Despite a strong showing by value factors, growth and momentum dominated the market given the returns of large cap Asian tech companies, helped in part by the demand for mobility and connectivity.
Non-U.S. Small Cap: Mixed Messages
Developed non-U.S. small cap (MSCI World ex USA Small Cap: +7.3%) outperformed large cap in the risk-on market environment marked by improving economic activity in Europe. The top three performing countries were Germany (+17.0%), Norway (+16.4%), and Italy (+13.5%). All sectors posted positive returns, led by Energy and Technology.
Small cap (MSCI Emerging Markets Small Cap: +5.6%) lagged large cap in emerging markets due to the strong performance of large cap Asian technology companies. The top three performing countries were Peru (+42.8%), Brazil (+31.8%), and Chile (+19.8%), all benefiting from higher oil and commodity prices.
Growth outperformed value in developed small cap, propelled by optimism surrounding European growth. Conversely, value outpaced growth in emerging market small cap, supported by positive oil and commodity prices.

