Capital markets continued to surge upward in 2Q21, replicating the prior quarter’s dynamics. Private equity fundraising and deal activity, with few exceptions, increased. Larger transactions drove dollar volumes. Capital markets have had a dramatic turnaround from the unsettled “price discovery” period of a year ago. A broad swath of new private equity transaction records are anticipated in 2021, as “risk-on” sentiments drive frenetic M&A and IPO liquidity, and institutional investors’ zeal for private equity continues to increase.
Fundraising: New Records
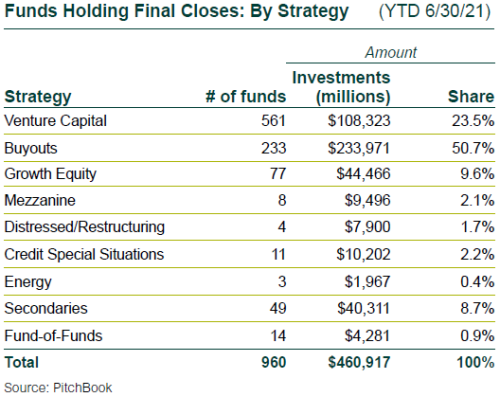
- Preliminary totals for new commitments to private equity partnerships holding final closes were up just $1 billion from 1Q21, but the number of new partnerships formed rose 10%.
- In 2Q, the largest European and Asia funds were raised. In the U.S., Hellman & Friedman X closed on $24.4 billion, just shy of the 2018 Apollo X record of $24.7 billion, and Carlyle stated its current Fund VIII may raise as much as $27 billion.
- The U.S. share of year-to-date commitments dropped to 66% from 72% in 1Q21, as non-U.S. commitments roared back.
- Venture capital’s renewed popularity and headline-grabbing exits increased its commitment share to almost one-quarter of all 2021 commitments.

Buyout Investments: Tracking Pre-Pandemic Levels
New buyout transactions took a 15% dip in count, but rose 3% in dollar value from 1Q, as larger transactions were consummated.
- While deal count preliminarily declined from 1Q, the total is tracking level with pre-pandemic quarters.
- As is evident from the largest investment (RealPage, software, $10.2 billion), software and tech continues to be a key driver of the market. Only the sheer breadth of the Business Products and Services category ($79 billion or 31% of new investments, versus $70 billion and 27%) keeps it in first position.
Pricing: Upward Trend Continues
Not surprisingly, average buyout pricing in the first half increased over full year 2020, which had the large 1Q price decline. As markets staged a strong recovery over the last 12 months, current prices are among the highest seen in past years.
- Average buyout prices rose to 13.0x EBITDA in the first half, compared to 12.7x EBITDA for the full year 2020. Average leverage multiples showed a marked increase to 7.5x EBITDA.
- As the public markets continue to march upward, so do expectations for private company prices in 2H21.
VC Investments: Fewer but Pricier Rounds
2Q21’s investment pace dipped 10% by number of rounds, but dollar volume rose 14%.
- Fewer rounds deploying more capital means higher prices, with pre-money valuations across all stages continuing to march upward. The largest 1H21 increase was in Series D rounds, up a remarkable 129%.
- The “E” in ESG captured the largest round of financing, which went to Northvolt, a Swedish electric vehicle battery maker, as climate change-related events across the globe made headlines.
- Unicorn financings jumped to 167 in 2Q from 114 in 1Q, and totaled 17% of 2Q’s total dollar volume.
PE-Backed M&A Exits: Surprisingly Slow
Amid a reported global M&A boom, 2Q was unremarkable as exits declined. The number of sales remained below pre-pandemic levels, and preliminary dollar volume was relatively weak.
- Private M&A exits of private equity-backed companies dropped only 2%, but disclosed value declined 24%.
- The largest sale was in the software services sector (Blue Yonder (Arizona), IT services, $7.1 billion), focusing on supply chain management for manufacturing and retail businesses.
PE-Backed IPOs: Triple Digits
The continued public equity rally powered the buyout-backed IPO count into the triple digits (106), with a sharp uptick in dollar volume. The trend is well above recent norms and should bolster future quarterly distributions as positions are gradually sold and distributed over time.
- Private equity-backed IPOs in 2Q were up 25%, with an even larger 31% step-up in total float.
- The largest investments were in the Fintech, regular Tech, and Specialty Foods sectors.
Venture-Backed M&A Exits: Continued Liquidity
Exits fell but transactions remained relatively high with a bolstered dollar volume, continuing a generally increasing trend in the venture-backed M&A exits area.
- The number of private sales declined 8% from 1Q, but announced value increased 48%.
- The administration has begun to make hawkish antitrust regulatory comments regarding acquisitions by large tech companies, particularly the FAANG stocks, which will bear watching.
Venture-Backed IPOs: Mixed Messages
2Q vaulted above 1Q’s remarkably strong quarter as investors continue to welcome venture-backed public market debuts.
- The number of VC-backed IPOs was up 7%, and the combined issuance soared 70%.
- However, the top three IPOs (Coinbase, $38 billion, Didi, $4.4 billion, and Full Truck Alliance, $1.6 billion) all suffered difficult aftermarkets. Punitive post-IPO actions by the Chinese government against both Didi and Full Truck Alliance caught many investors by surprise, and will likely cast a pall on other China-based offerings, which so far in 2021 have raised a record $21 billion on U.S. exchanges.

Returns: Great Quarter to Start the Year
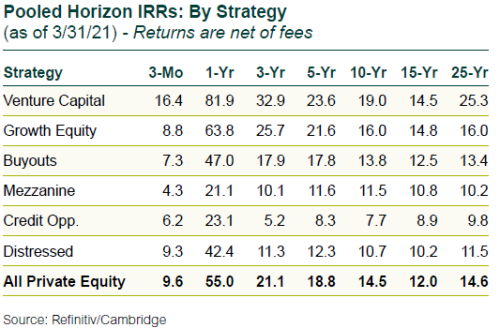
During 1Q, U.S. public markets rose significantly for a fourth straight quarter. Private equity returns bested public equity by more than 3 percentage points.
- While private equity lags public equity over the last 12 months, it is important to remember that in the days after the 1Q20 pandemic rout, private equity had fallen by less than half public equity’s 20% decline. Private equity’s 55% is calculated off a much less compromised starting point in investor’s portfolios.
- Venture capital’s one-year return of 82% is particularly impressive.
- The Refinitiv/Cambridge private equity database continues to outperform broad public equity indices over all horizons of three years or more.
