Listen to This Blog Post
Our 2025 Defined Contribution Trends Survey covers the key tenets of DC plan management such as governance, investments, fees, plan design, and more. The insights distilled in the 18th annual edition of our survey provide a benchmark for sponsors to evaluate their plans compared to peers, and to offer actionable information to help them improve their plans and the outcomes for their participants.
This blog post summarizes highlights from the survey, which was conducted online in late 2024. This survey incorporates responses from 89 DC plan sponsors, both Callan clients and other organizations. Respondents spanned a range of industries, with the top being financial services and government. More than 90% of plans in the survey had over $200 million in assets, and 58% had more than 10,000 participants. Seventy percent of respondents were corporate organizations, followed by public plans (25%) and tax-exempt (6%) entities.
Other highlights from the 2025 DC Survey:
Oversight
- Reviewing the investment policy statement was the most prevalent fiduciary action taken (86%), which was consistent with 2023. Completing formal fiduciary training came in second (73%), representing a sizable increase from 2023 (53%).
- Top areas of focus for DC plan sponsors in 2024 included investment management fees, fund/manager due diligence, and investment structure evaluation.
- In line with the past four years, most sponsors used participation rate to gauge plan success.
Investments
- In 2024, 96% of respondents offered a target date suite and 93% used a target date fund (TDF) as their default for non-participant-directed monies.
- Among those that offer TDFs, 8 in 10 used an implementation that was at least partially indexed. The share of active-only strategies dropped by a percentage point to 20%.
- More than 8 in 10 respondents took at least one action around the target date fund suite in 2024. The most common were to evaluate the suitability of the underlying funds and the suitability of the glidepath. These were also the two most common actions respondents said they plan to take in 2025.
- 12% of respondents said they evaluated a guaranteed lifetime income feature within a target date fund framework in 2024, but only 2% added such a feature to their target date fund offering. In 2025, 20% plan to evaluate such a feature, with 6% saying they plan to add one.
- In 2024, relatively few respondents reported they include or are considering the inclusion of alternative investments in their DC plan’s TDFs.
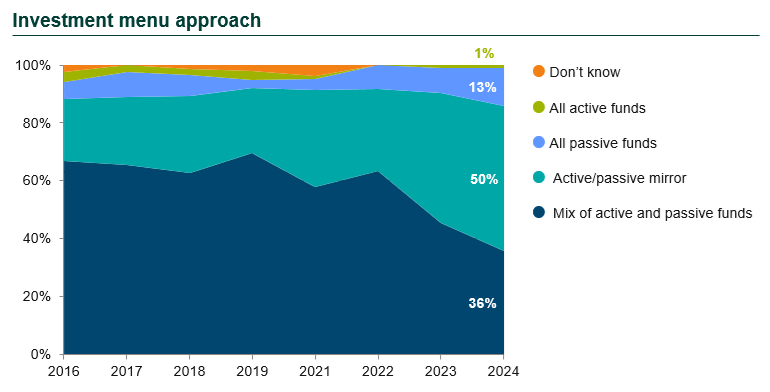
- There was a sizable increase in DC plans offering an active/passive mirror versus those offering a mix of active and passive funds, with a mirror coming in at an all-time high of 50%. A mirrored lineup is when virtually all core asset classes are represented by both active and passive options.
- DC plans with a mix of active and passive investment funds (86%) were the most prevalent. Purely passive (13%) lineups remained a rarity, with a purely active menu being even more rare (1%).
- Mutual funds and collective investment trusts (CITs) continued to be the most prevalent investment vehicles, with mutual funds (84%) offered by slightly more respondents than CITs (79%).
- 30% of respondents offered white label funds, with more offering white label funds with multiple underlying managers than with a single underlying manager. The most common asset classes for white label funds with multiple underlying managers were non-U.S. equity and U.S. smid cap equity.
- 27% of respondents said that the managers of the index-based funds in their core fund lineup engaged in securities lending, 44% said their managers did not, and 29% did not know.
- Three-quarters of respondents did not offer an environmental, social, and governance (ESG) fund in the core fund lineup. But 7% will consider adding an ESG option in the future and the other 18% already do.
Fees
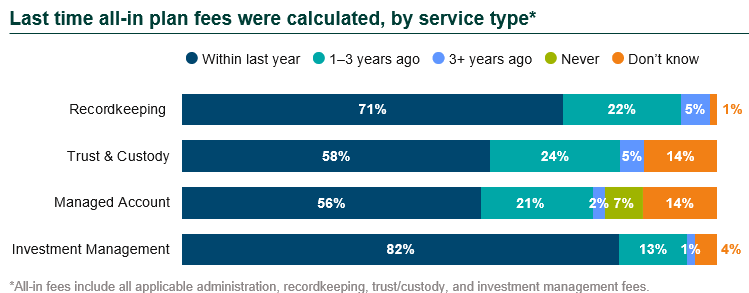
- All-in administration fees can encompass a variety of expenses, including recordkeeping, participant transaction fees, compliance, custody, communications, and indirect sources of revenue. About 7 in 10 plan sponsors calculated their DC plan recordkeeping fees within the past 12 months. Another 22% did so in the past one to three years.
- Higher levels of scrutiny were seen for investment management fees; as a major target of litigation, reviewing the investment management fees regularly is considered best practice.
- When calculating fees, over half of respondents also evaluated sources of indirect revenue (e.g., revenue shared with the recordkeeper from managed accounts, brokerage windows, IRA rollovers, etc.).
- 65% of respondents said they had evaluated the usage of forfeitures within the last year, with another 10% having done so within the last 1 to 3 years.
- Within the last year, 52% of respondents said they had evaluated how float income was handled within their DC plan. Notably, 18% of respondents had never evaluated the treatment of float income.
Advice Services
- All respondents offered some type of advisory service to participants.
- 57% of respondents offered a managed account service. Of those, more than half said that their managed account provider actively promotes the service to encourage participation.
- Over 70% of plan sponsors said they monitor/benchmark their managed account service. Among respondents that monitored their managed account service, more than 90% reviewed fees and services, while more than 80% reviewed participant usage and interaction. About two-thirds reviewed the methodology and investment outcomes. There was also a sharp increase in the percentage of respondents that indicated they benchmark the performance of the managed account service, from 29% in 2023 to 63% in 2024.
- Plans reported high levels of satisfaction with investment advisory services. Financial wellness services received the highest overall marks, with 96% of respondents very or somewhat satisfied.
- The service with the largest percentage of dissatisfied respondents was managed accounts.
- Survey respondents noted that Roth deferrals (84%) and automatic enrollment (80%) were the most common enhanced savings features.

Roll-ins and Post-retirement Issues
- 96% of respondents reported they offer participants the opportunity to roll in qualified assets from their previous employer. Yet only 30% actively promoted this plan feature.
- The majority of plan sponsors with a strategy around asset retention sought to retain the assets of both retiree and terminated participants, a notable increase from 2015 (44%). More than 8 in 10 plans sought to retain retiree assets, while fewer sought to retain terminated participant assets (54%).
- Most respondents offered some type of retirement income solution to employees in 2024. Partial distributions (75%) and installment payments (63%) remained the most common.
- In 2024, relatively few respondents reported offering an annuity platform service or a TDF with a guaranteed income component. However, 19% said they are considering a TDF with an integrated participant option to purchase an immediate annuity.
This blog post summarizes the key findings of our survey, but the full survey contains far more detail about all of these areas and extensive breakdowns of the data we gathered.
Along with the data in our quarterly Callan DC Index™ and Target Date Index™, this survey paints a detailed picture of the challenges and opportunities that are top of mind for DC plan sponsors.
Disclosures
The Callan Institute (the “Institute”) is, and will be, the sole owner and copyright holder of all material prepared or developed by the Institute. No party has the right to reproduce, revise, resell, disseminate externally, disseminate to any affiliate firms, or post on internal websites any part of any material prepared or developed by the Institute, without the Institute’s permission. Institute clients only have the right to utilize such material internally in their business.