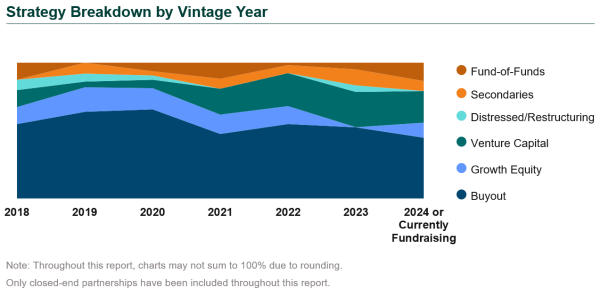
In an update to our two previous editions, Callan conducted our 2024 Private Equity Fees and Terms Study by analyzing 413 private equity partnerships, representing fund offerings in the market from 2018-24 (including funds currently fundraising). This study is intended to help institutional investors better evaluate private equity funds, serving as an industry benchmark when comparing a partnership’s terms to its peers. It can also be useful for general partners, to determine how their fees and terms compare to other managers.
With each year, the study’s dataset broadens, and this year we include a wide variety of general partners (GPs) and strategy types. We have also expanded this year’s study to include fund-of-funds and secondaries funds. This year’s study leverages CallanDNA as the data source, which is Callan’s proprietary database application. It includes the partnerships that were evaluated in Callan’s prior studies and adds more recent partnerships. The data was pulled from the funds’ limited partnership agreements or private placement memoranda, in addition to direct submissions by investment managers into CallanDNA.
We focused on the following principal terms to provide a concise snapshot of the market:
- Minimum limited partner (LP) commitment
- General partner commitment
- Management fees
- Type of “waterfall”
- Carried interest percentage
- Preferred return and general partner (GP) catch-up
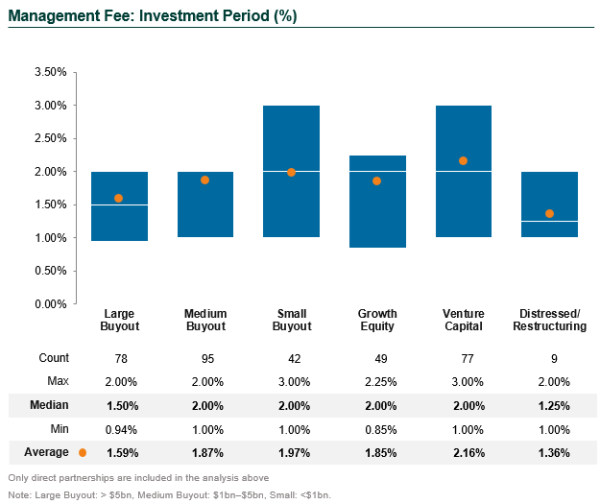
Unlike trends observed in other asset classes (namely the public markets), private equity fees have not come down over time. Most private equity managers are not inclined to change their fees from one fund to the next, leading to relative stability in fees, at least over shorter timeframes. Fees today are not that much different than fees seven years ago. Any variability from year to year is dependent on the strategy composition of the dataset. Fees can vary widely by strategy type, with two key observable trends: (1) higher risk/return strategies (namely venture capital) typically charge higher fees; and (2) smaller funds also tend to charge higher fees. As a result, the more venture capital and small buyout funds in the dataset, the higher the aggregate fee calculations.

Fund-of-funds and secondaries funds represented 16% of the dataset. Of the direct partnerships included in the study, they were weighted toward buyout funds, which represented 52% of the partnerships (61% of direct partnerships). Venture capital and growth equity represented an aggregate 31% of the dataset (36% of the direct partnerships). Distressed/restructuring funds consistently represent a small portion of the dataset at just 2%.
Highlights from Our 2024 Private Equity Fees and Terms Study
- Minimum LP Commitment: $10 million remained the most common, at 37% of the dataset. The average was $8.8 million.
- Average GP Commitment: The level of 3.6% represented a drop from 4.2% in our last study, reflecting the inclusion of more venture capital funds in this year’s study, which tend to have lower GP commitments.
- Management Fees: During the investment period, the median was 1.75%-2.00%, consistent with prior studies. Fees after the investment period dropped by 20-25 bps. This fee also varies widely by strategy type.

- Fee Offset: Every fund in the dataset offset management fees by any transaction, monitoring, or other fees paid to the general partner, and the vast majority had a 100% offset.
- Waterfalls: American waterfalls (deal-by-deal) were far more prevalent than European waterfalls (fund-as-a-whole), which are more friendly for limited partners.
- Carried Interest: The vast majority of funds charged 20%.
- Preferred Return: Of the dataset, 84% had a preferred return of 8%, and most used a compounded calculation for the return.
Two New Additions to the Study
In broadening our dataset, the addition of fund-of-funds and secondaries funds serves as a helpful benchmark for these types of strategies. These funds have especially complex fee structures with varying levels of carried interest and tiered management fee structures.
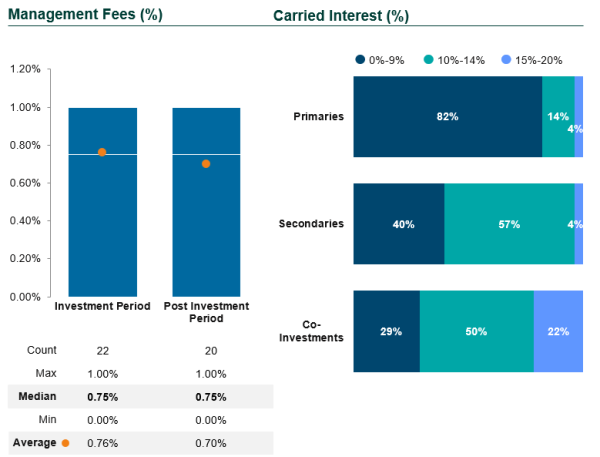
- Fund-of-Funds: These represented 29 partnerships in the study. Given they charge two layers of fees, fund-of-funds management fees tend to be lower than direct partnerships, with an average of 0.76% during the investment period and 0.70% post. The carried interest structure of fund-of-funds also differs from direct funds, as fund-of-funds charge different carried interest percentages on different sleeves of the program (primaries, secondaries, and co-investments). The primaries sleeve of a fund-of-funds typically charges the lowest carry (often 0% or 5%), while the secondaries and co-investments sleeves will charge 5% or 10%.

- Secondaries: These represented 27 partnerships. Secondaries funds typically charge higher fees than diversified fund-of-funds, with management fees averaging 1.07% during the investment period and 1.04% post. Carried interest is also typically higher, with most secondaries funds charging 10%-15% carried interest.
Each year this study is conducted, the growing size of the dataset becomes more representative of the broader private equity industry. With data now stretching back seven vintage years, we have a greater ability to see trends in fees over time.
Disclosures
The Callan Institute (the “Institute”) is, and will be, the sole owner and copyright holder of all material prepared or developed by the Institute. No party has the right to reproduce, revise, resell, disseminate externally, disseminate to any affiliate firms, or post on internal websites any part of any material prepared or developed by the Institute, without the Institute’s permission. Institute clients only have the right to utilize such material internally in their business.

