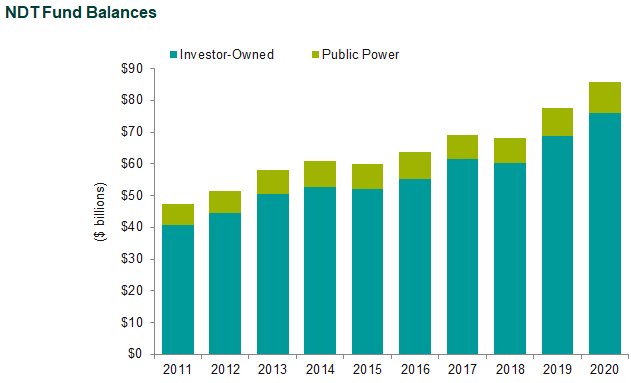
Callan’s annual Nuclear Decommissioning Funding Study offers key insights into the status of nuclear decommissioning funding in the U.S. to make peer comparisons more accurate and relevant. In our 2021 study, we found that nuclear decommissioning trust (NDT) fund balances totaled nearly $86 billion in 2020, up 10.5% from a year earlier largely due to capital markets performance. Those gains in the equity and fixed income markets also helped total funding as a percentage of total decommissioning cost estimates, which hit 85.6% in 2020, a 7 percentage point increase from the previous year.
Our study also found that total decommissioning cost estimates reached $100 billion in 2020, a 1.4% increase from a year earlier. And total contributions from utilities into their NDTs fell to $248 million in 2020, a 15% decrease from 2019.

NDTs are created to pay for the costs of decommissioning a closed nuclear power plant, which involves safely removing it from service and reducing residual radioactivity to a level that permits release of the property and termination of the operating license. Nuclear power provides 20% of electricity generation in the U.S., according to 2020 data from the U.S. Energy Information Administration.
The 2021 study covers 27 investor-owned and 26 public power utilities with an ownership interest in the 94 operating and 14 of the non-operating nuclear reactors in the U.S. Of note, four units have received their second 20-year license renewal while several more have applications under review by the Nuclear Regulatory Commission (NRC). The number of utilities with an ownership interest declined steadily in the early- to mid-2000s, due primarily to mergers/acquisitions and the sale of nuclear-generating facilities. In recent years private companies have been buying shut reactors and taking over their licenses, liabilities, and decommissioning funds with the goal of turning a profit.
As part of our study, our team gathers both NRC and site-specific total cost estimates where possible in order to capture the relative magnitude of the two figures. Labor, energy, and waste material transportation and disposal are the primary components of decommissioning costs. Costs can be based on either an NRC minimum cost formula or a site-specific estimate calculated by an engineering firm—as long as that amount is greater than the NRC figure. Site-specific engineering studies provide the most reliable decommissioning cost estimates. These studies often include costs beyond the NRC’s scope of decommissioning, such as spent fuel management and site restoration (also known as “green fielding”), which together can run into the hundreds of millions of dollars.
Site-specific cost estimates totaled over $85 billion versus $44 billion under the NRC minimum formula in 2020, a difference of $41 billion. The median site-specific total cost estimate was 1.86 times the NRC minimum formula amount for all plants regardless of ownership. Assuming license termination costs (the NRC portion of decommissioning) represent approximately 60%-70% of total site-specific costs, the NRC formula amounts are roughly in line with the site-specific estimates for license termination. Taking the assumption one step further, if the license termination portions of the site-specific estimates are roughly in line with the NRC formula amounts, then spent fuel management and site restoration costs are what account for most of the additional $41 billion in decommissioning costs.
Other key findings from our nuclear decommissioning funding study:
- The median escalation rate (used in forecasting future decommissioning expenditures given current dollar cost estimates) for all plants was 3.10% with an average of 3.42%.
- Given limitations to the data, we were only able to review the asset allocations for 22 investor-owned utilities. All of them were invested in equities and fixed income, with a median allocation of approximately 62% equity and 36% fixed income.
- The median investment return for all NDTs was 13.6% for 2020, with an average of 12.7%.
- Public power trust returns were 350 basis points below those of investor-owned trusts on average and exhibited a much wider range of results due to a number of trusts being 100% fixed income.

