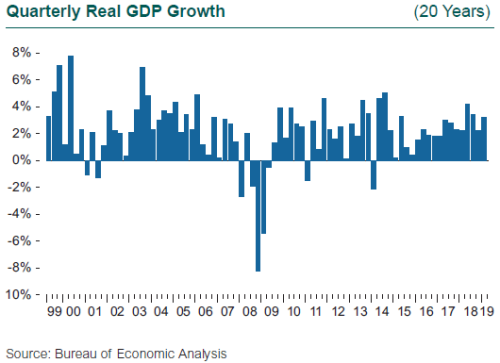
Investor confidence has shifted wildly over the past six months. Anxiety, panic, and gloom pushed equity markets down around the globe through the last three months of 2018, culminating in one of the worst Decembers in decades. The pessimism derailed global interest rate policy. The central banks in the euro zone had yet to join the U.S. in reversing years of monetary easing, and they may now skip this cycle of tightening altogether. The Fed pressed “pause” on its own tightening plan in January after nine rate hikes. The equity markets then surged during the first quarter of 2019, moving back toward the all-time high set last October, and volatility evaporated.
What changed in the fall of 2018 and then in the first quarter of 2019 to cause this whipsaw of sentiment? U.S. GDP growth softened in the fourth quarter to a still healthy 2.2%, but then notched a surprisingly strong 3.2% increase in the first quarter. This robust gain is a sign of resilience in the face of the fourth quarter market swoon and the uncertainty generated by the government shutdown in January of this year. The increase also reversed a pattern in recent years of inexplicably slower growth in first quarter GDP. The solid GDP report was accompanied by a surge in durable goods orders reported in March, strong exports, sustained job growth, and of course the reversal of the fourth quarter stock market slump.
All of the sudden, everything is fine again. Or is it? Underneath all the good news, there are signs that we may be at the peak of the current economic cycle. More than half of the robust first quarter GDP gain came from net exports and inventory accumulation. Greater investment in inventories now, which adds to GDP, means less investment in the future. Exports rose and imports slumped; both are positive contributions to GDP but neither may be sustainable. Final sales to domestic purchasers, which excludes both trade and inventory building, rose at a more modest 1.4% rate, down from a 2.1% gain in the fourth quarter. Personal consumption inched up 1.2%, less than half the growth rate enjoyed over the year in 2018. To be fair, the weakness in these quarterly data appears to have been concentrated at the start of the year, and the reports for many indicators showed a big bounce in March.

On the positive side of the ledger, the government shutdown in January had a temporary effect, shifting the timing of activity and employment, but the net impact should be minimal. The job market saw a sharp drop in February, to just 33,000 new jobs, only to see a snap back to 196,000 in March. The average gain for the first three months was 180,000, lower than the average for last year but substantially above the bellwether mark of 100,000 per month required to keep the economy growing. Manufacturing employment in the U.S. declined in the first quarter, despite the residual strength in capital goods orders. While both the Markit manufacturing and services PMIs slipped in the first quarter, they remain above readings of 50, the dividing line between expansion and contraction. Of particular interest is the eye-catching rebound in China’s manufacturing PMI, which jumped from a borderline reading of 50 to 58 in March.
The narrative has changed sharply since the nadir of December 2018. The stock market slump reversed, credit spreads have narrowed, and the potential for the yield curve to steepen has returned. The rebound in GDP and durable goods orders in March, the resilience of the job market, and the gain in net exports reinforce the perception that we are poised to see economic growth reaccelerate in the second quarter. Not all the indicators suggest good news, however. Oil prices have rebounded, driving up gasoline prices and crimping household disposable income. Home price gains, which have an attendant wealth effect typically more widespread and powerful than the wealth effect from the equity market, are slowing. Finally, the continuing strength of the dollar adds to the headwinds facing manufacturing.
Trade and trade policy dominates headlines, but it is worth noting that the impact of trade in the U.S. is far lower than in most of our trading partners, both developed and emerging. One measure is the trade-to-GDP ratio, the sum of exports and imports as a percentage of GDP. (Note that exports add to GDP while imports subtract from GDP, but the sum of their share of GDP is a reasonable measure of the impact of total trade activity on an economy.) Exports and imports include both goods and services. Trade has certainly become a larger component of U.S. GDP over time, with exports rising from 7% in 1985 to 12.3% in 2018 while imports rose from 9% to 15.5%. Trade activity now involves 27.8% of U.S. GDP. By comparison, the World Bank calculates that trade accounts for 37.8% of China GDP, 62.5% for the U.K., 77.6% for Mexico, and 87% for Germany.

