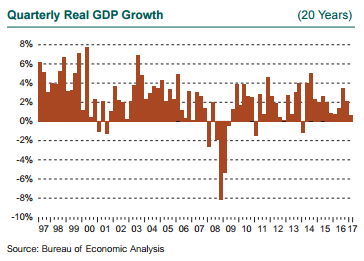
For the fourth year in a row, reported GDP growth disappointed in the first quarter, coming in at just 0.7%, down from a 2.1% rate in the fourth quarter and the weakest rate in three years.
This paltry gain for the U.S. economy was concentrated in consumer spending on autos and utilities (reflecting unseasonably warm weather in states with typically cold winters), a drop in defense spending, and a sharp slowdown in inventory accumulation.
“Softer” measures of economic activity like consumer confidence and the ISM Report on Business, which records the forward-looking purchasing intentions of industry, held up through the first quarter, countering the weakening of GDP as the quarter unfolded. Business and consumer confidence rose after the U.S. presidential election in likely anticipation of changes to policy and taxes, without any reference to the strength of the underlying economy.
The question is whether we really have an annual “hitch in our git-along” each January, or is something else going on? Four years in a row with an unexpected drop in growth during the first quarter, which is then typically made up with an offsetting increase in the second quarter—although the GDP numbers are supposed to be seasonally adjusted—suggests perhaps a problem with this metric of evaluating the volume of our economic activity.
Increasing Scrutiny of GDP
GDP has come under increasing scrutiny as an outdated measure of the modern U.S. (and global) economy. It focuses more on the flow of traditional goods and services, particularly agriculture and manufacturing. GDP may be very challenged to measure the output and economic impact of industries such as software, social media, and electronic commerce.

Inventory buildup usually signals confidence in the prospects for the economy. For several years prior to 2016, inventory “de-cumulation” was a clear drag on growth, as firms were reluctant to maintain output in the face of soft demand. The U.S. economy shifted toward inventory accumulation in the third and fourth quarters of 2016, only to reverse in the first quarter. That reversal subtracted almost 1% from GDP growth.
Total personal consumption expenditures led broad economic growth in 2016, averaging gains of well over 3% during each of the last three quarters of the year, only to drop to just 0.3% growth during the first quarter.
Mixed Jobs Picture
The U.S. job market enjoyed a robust 2016, adding 2.2 million new jobs. The economy entered 2017 with two strong months in January and February, adding more than 200,000 net new jobs each month, before the rate of job creation halved in March to 98,000. Retail jobs took a serious hit in both February and March (seasonally adjusted), with the continuing advance of e-commerce challenging retail establishments, particularly shopping malls.
Signs now point to further softness in the job market as the second quarter begins. In spite of this potential softening, the unemployment rate dipped to 4.5% in March, the lowest in the current cycle.
Many urban regions report very tight job markets, with unemployment rates as low as 2% to 3%. In response, the growth in average hourly earnings, stuck in a narrow range below a 2% annual rate for five years following the Global Financial Crisis, rose above 2.5% annual growth during 2016 and continued at this rate through the first quarter.

The minutes of the past several Federal Reserve Open Market Committee meetings show a continuing split among members about whether an acceleration of inflation is a looming concern. The data suggest inflation remains low, and futures markets indicate expectations are still anchored at or below the Fed’s long-term target of 2% for core inflation.
How the CPI Did
While the Fed uses the consumption deflator in its targeting, the CPI is still a useful measure of price activity. The headline CPI All-Urban index rose 2.4% year-over-year through March, although the measure actually declined between February and March. The energy portion of the Index rose 10.9% over the last 12 months, even after a 3.2% drop in March. This reflects a return toward normal in energy prices after the sharp drop in 2015.
The core measure of CPI—which excludes food and energy—rose 2.0% over the 12 months ended in March, the smallest 12-month increase since the end of 2015.
For a complete collection of economic and market-related data, we invite you to download our 1st Quarter 2017 Market Pulse.
0.7%
GDP growth in the first quarter, the weakest rate in three years.

