The debate over active vs. passive management is endless, and it spans many different asset classes and investment styles. And for an issue that seems to involve cold, hard math, the discussion can get subjective and even passionate.
Most investment professionals would agree the answer to which is better is not binary—simply yes or simply no. Instead, it is more nuanced, with results differing across investment styles and through time. Market efficiency, liquidity, capacity, and investment costs vary widely across different areas of the capital markets. These factors can affect the ability of active managers to add value consistently net of fees, as well as the ability of asset owners to implement and stick with active programs.
Callan has created an objective and consistent framework to evaluate the quantitative evidence for the value-added of active management in various investment areas using the long history of active manager data in our proprietary database. We update this Active vs. Passive Report, covering over 50 asset classes and investment styles, every quarter and post it to our website.
Our methodology measures the consistency of active managers’ ability to beat an appropriate index over many rolling three-year periods. We use three-year net of fee excess return observations to both mimic institutional asset owners’ performance evaluation timeframes (and patience for underperformance and sticking with managers) and avoid the survivorship bias effect that would come with using long-term cumulative returns. The idea is that if active management can produce positive excess returns consistently over medium-term evaluation periods, then asset owners will be more likely to stick with active and reap the potential benefits.
The long-term perspective of the analysis comes from our use of 20 years of rolling three-year results (23 years in total) to “score” active management’s success rate. The measure of success is the percentage of rolling three-year periods over the last 20 years with positive net-of-fee excess return over the benchmark (more than 50% is good).
Our methodology also acknowledges two very important assumptions that affect the results for active management:
- varying fee levels paid for active management
- varying levels of skill at selecting active managers
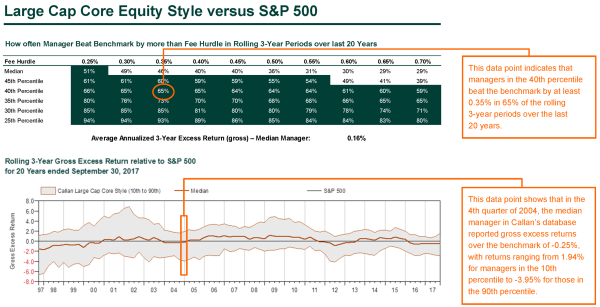
In order to enrich the analysis, we vary both of these assumptions and score active management with various combinations of fee levels and manager skill. As the assumed fee level goes down and/or the assumed manager skill level goes up, the results for active management improve. The top chart on each page of the report shows these results at various combinations of fees and manager skill. The results greater than 50% are highlighted green.

In order to illustrate the variability and size of active management excess returns through time—and potentially reveal secular trends or cyclicality in results—we include a chart on the bottom of each page showing the range of all the three-year rolling gross excess returns (no fee assumptions) over the last 20 years. The median as well as the 10th and 90th percentile results are highlighted to show the potential upside and downside of manager skill levels.
Callan’s quarterly Active vs. Passive Report attempts to objectively monitor the quantitative evidence for/against active management in a manner that minimizes survivorship bias, recognizes real-world differences in investors’ implementation capabilities (fees and manager skill), and evaluates long-term results (23 years) through the lens of rolling medium-term consistency. This lens reflects investors’ performance evaluation timeframes and the behavioral aspect of needing to stick with their active managers through short-term underperformance in order to reap the potential long-term benefits.

