Listen to This Blog Post
In our previous post examining the private real estate market in early 2023, institutional investors were grappling with the initial impact of rising interest rates, which began driving asset value declines after a period of record-breaking performance in 2021 and the first half of 2022. Fundamentals across most sectors—apart from traditional Office—remained relatively strong, but a sharp repricing was underway as appraisers adjusted discount and cap rate assumptions to align with the new financial landscape. In this post, we examine the changes in the real estate market over the past two years, including trends in valuations, transactions, and redemptions, to help institutional investors navigate the current market environment.
Market Environment Summary for Private Real Estate
3Q24 marked the end of a seven-quarter streak of negative quarterly net returns for the NCREIF Fund Index Open-End Diversified Core Equity Value Weight (NFI-ODCE Value Weight) dating back to 4Q22. Market participants view this as a possible turning point. The quarter’s returns consisted of yet another period of negative appreciation return, barely offset by positive income return. As of Sept. 30, 2024, the market experienced nine consecutive quarters of negative appreciation returns, stretching from 3Q22 to 3Q24.
The Federal Reserve’s 11 interest rate hikes between March 2022 and July 2023 resulted in a 525 bps increase in the Fed Funds rate and were the primary catalyst for declining real estate values in most sectors over the past two years, despite robust economic growth during this period. The primary exception, traditional Office, faced significant fundamental challenges due to remote and hybrid work leading to reduced space demand. In the Multi-family and Industrial sectors, a surge of new supply—spurred by strong tenant demand and historically low interest rates in 2021—led to rising vacancy rates and slower rent growth as these projects came online. Despite these pressures, both sectors have generally shown resilience. Meanwhile, the Retail sector, which faced headwinds in 2018 and 2019, continued to perform relatively well, benefiting from adjusted valuations and limited new supply deliveries in recent years.
Fundamentals in most alternative property sectors remained strong, although the life sciences sector is a notable laggard due to the combination of a pullback in occupier demand and significant new supply in the major life sciences markets. One notable advantage of higher interest rates is their dampening effect on new development activity, which is benefiting overbuilt sectors such as Apartments and Industrial properties.
The tables below highlight performance trends for three key open-end real estate benchmarks: NFI-ODCE Value Weight, NFI-ODCE Equal Weight, and the NCREIF Property Index (NPI). These tables illustrate the challenged performance of core real estate benchmarks following the recent repricing. Calendar year returns reveal that after strong performance in the years leading up to the COVID-19 pandemic, the market experienced a record-breaking year in 2021, followed by negative returns in 2022, 2023, and 2024, which erased many of those gains.


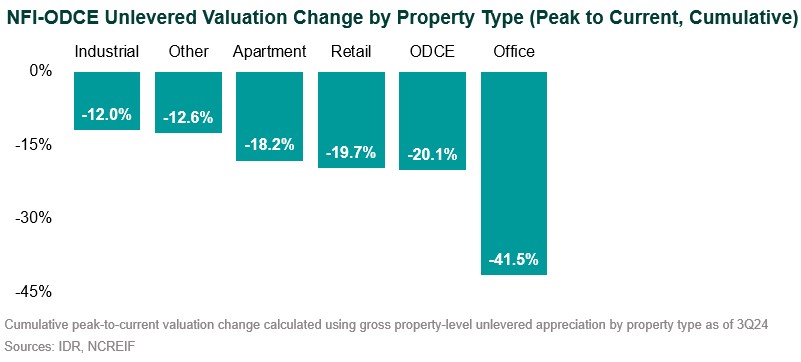
The chart below details the unlevered depreciation of the NFI-ODCE Index from peak to trough by sector as of Sept. 30, 2024. This chart shows that while unlevered property values across the NFI-ODCE Index declined by 20.1% in aggregate, the Office sector was the primary detractor from performance, with unlevered depreciation of 41.5%.

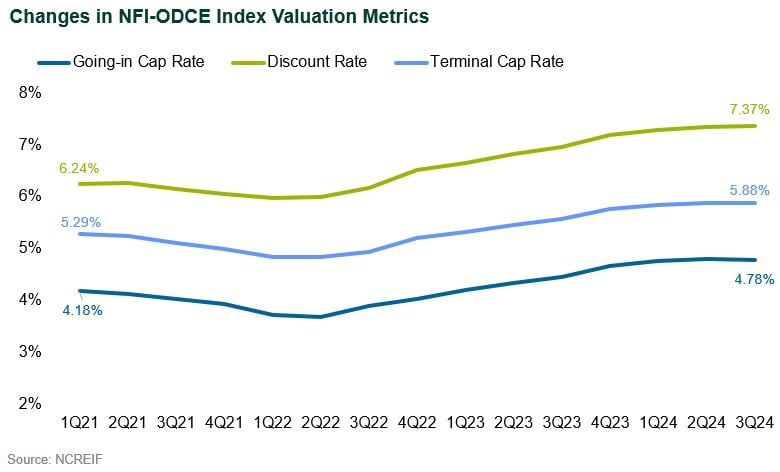
The chart below details the changes in valuation metrics across various sectors since 1Q21. Throughout 2021 and into early 2022, appraisers consistently made downward adjustments to going-in cap rates, discount rates, and terminal cap rates, resulting in property appreciation and strong performance.
However, valuation metrics reached a trough in 2Q22 as appraisers responded to the Federal Reserve’s interest rate hikes. Going-in cap rates—representing the initial capitalization rate or yield at the time of acquisition, calculated as the projected first-year net operating income (NOI) divided by the initial investment or purchase price—increased by 139 basis points, rising from 5.98% in 1Q22 to 7.37% in 3Q24. Discount rates—representing the rate used to discount a stream of future cash flows to present value and reflecting an investor’s required rate of return or opportunity cost—rose by 104 basis points, climbing from 4.84% in 2Q22 to 5.88% in 3Q24. Terminal cap rates—representing the exit capitalization rate, calculated as a property’s projected NOI in the final year of the holding period divided by the projected sales price—rose by 112 bps, increasing from 3.69% in 2Q22 to 4.81% in 2Q24, before declining by 3 bps in 3Q24.
Collectively, these trends indicate a broad market recalibration, with appraisers adjusting to evolving conditions such as higher interest rates, economic uncertainty, higher required rate of return and shifts in investor sentiment. Notably, the pace of valuation metric adjustments has slowed, with going-in cap rates and discount rates stabilizing, while terminal cap rates decreased slightly in 3Q24. This plateau or stabilization may suggest reduced volatility ahead, as appraisers appear to believe that current valuations fully reflect the prevailing market environment.

Redemption Queues, Payments, and Rescissions
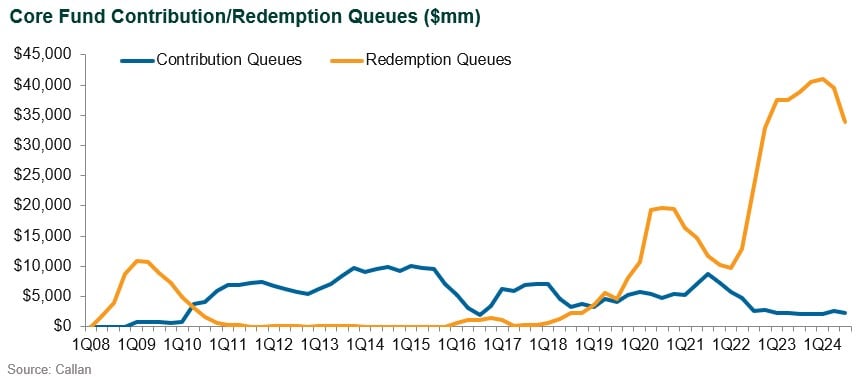
As of Sept. 30, 2024, 24 out of the 25 funds in the NFI-ODCE Index had a redemption queue, and in aggregate, those redemption requests totaled $34 billion across the index. The dollar amount in the NFI-ODCE Index tied up in redemption queues represented 16.4% of net asset value (NAV) in 3Q24, a sharp decline from 18.9% in 2Q24 and 19.3% in 1Q24. Redemption queues vary widely by fund, based on a variety of factors, including organizational stability, performance, and exposure to the Office sector, among other things.

The key driver of the decrease in redemption queues in 3Q24 was significant rescissions of redemption requests across a handful of large funds. Rescission activity totaled $5.3 billion across the NFI-ODCE Index, but $4.8 billion of those rescissions came from just four funds. These include funds that introduced new loyalty fee programs or changed existing loyalty fee programs, as well as others that simply had investors using their redemption requests as placeholders and beginning to rescind those requests. Investment managers reported to Callan that they expect rescission activity to continue in future quarters, although it is impossible to forecast the amount and timing.
Redemption payments from managers over the past two years have been minimal, averaging approximately 5% of the total redemption queue per quarter. Managers have cited minimal transaction activity as the primary reason for being unable to make larger payments to address redemption queues. As transaction activity increases, NFI-ODCE Index fund managers have made larger payments, totaling approximately $2.9 billion across all 25 funds representing an average of 7% of the total redemption queue. Some managers are reporting larger redemption payments following 3Q24, with certain funds clearing up to 25% of their queues this quarter. Callan expects the trend of larger redemption payments to continue throughout 2025, leading to greater liquidity for investors awaiting redemption proceeds and contributing to a reduction in overall redemption queues across the NFI-ODCE Index.
Why Maintain Real Estate in Diversified Institutional Investment Portfolios
Despite recent headwinds, exposure to core real estate continues to represent a compelling allocation in most diversified institutional investment portfolios. Core and core plus real estate offer institutional investors a combination of income stability, growth potential, and diversification benefits over long time periods. Core and core plus real estate strategies are well-positioned to capitalize on easing interest rate pressures and narrowing bid-ask spreads. Additionally, today’s environment presents tactical opportunities for capital appreciation due to adjusted valuations and the expectation of lower interest rates.
Core and core plus real estate funds have also experienced an increase in diversification by geography as allocations shift away from a handful of key gateway markets to a variety of gateway and growth markets; additionally, property sector diversification has increased substantially, with allocations to alternative property types—such as data centers, self-storage, life sciences, medical office, student housing, manufactured housing, age-restricted housing, and single-family rentals—set to continue to grow in the near future.
Looking Ahead
The outlook for U.S. commercial real estate performance in 2025 and beyond is nuanced. The Multi-family and Industrial sectors have exhibited resilience, while some alternative property sectors like data centers are supported by long-term growth tailwinds. Meanwhile, the Office sector is widely expected to continue to grapple with high vacancies and reduced demand.
Several key risks to the commercial real estate market remain, including persistent high interest rates, debt maturities, rising expenses (including insurance costs), climate-related impacts, and an uncertain geopolitical environment; however, most investment managers and research institutions are cautiously optimistic about the stabilization of the real estate market heading into 2025. The Pension Real Estate Association (PREA) assembles a quarterly survey of investment managers’ forecasts for NPI returns. The 4Q24 PREA Consensus Forecast, which was conducted in November 2024 and included 27 participants, indicated that participants expect a total gain of 6.6% in 2025, comprised of income returns in line with historical averages, continued negative appreciation in the Office sector, and slightly positive appreciation in all other sectors. Participants are then forecasting a stronger recovery in 2026 with a forecasted total return of 7.6%, led by stronger appreciation in all sectors, including Office.
However, the path of interest rates introduces a critical element of uncertainty. A sharper-than-expected decline in rates could serve as a powerful catalyst for stronger returns, while sustained elevated rates or further hikes would likely exacerbate financial pressures, tempering market recovery and growth.
Finally, we would like to once again highlight that in prior cycles, the NFI-ODCE Index total returns following the trough value decline have been very strong. Institutional investors with long-term strategic allocations to real estate are advised to remain invested, and tactical investors looking for the right entry point may finally see the opportunity that they have been waiting for.

Disclosures
The Callan Institute (the “Institute”) is, and will be, the sole owner and copyright holder of all material prepared or developed by the Institute. No party has the right to reproduce, revise, resell, disseminate externally, disseminate to any affiliate firms, or post on internal websites any part of any material prepared or developed by the Institute, without the Institute’s permission. Institute clients only have the right to utilize such material internally in their business.


