Listen to This Blog Post
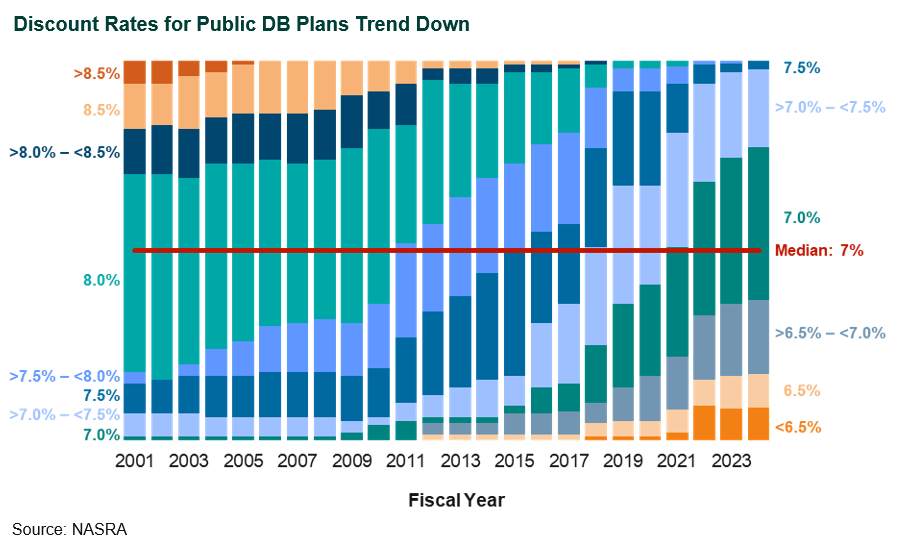
There are two clear trends among public defined benefit (DB) plans over the last 20 years. The first is a movement toward lower discount rates. Where the median plan surveyed by NASRA was closer to 8% in 2003, 20 years later the median plan is 7%. In the last survey, all plans had a discount rate below 8%. The shift to lower discount rates gained momentum following zero-interest rate policy from the Federal Open Market Committee (FOMC), which began in 2008 and effectively lowered the expected returns of all asset classes.
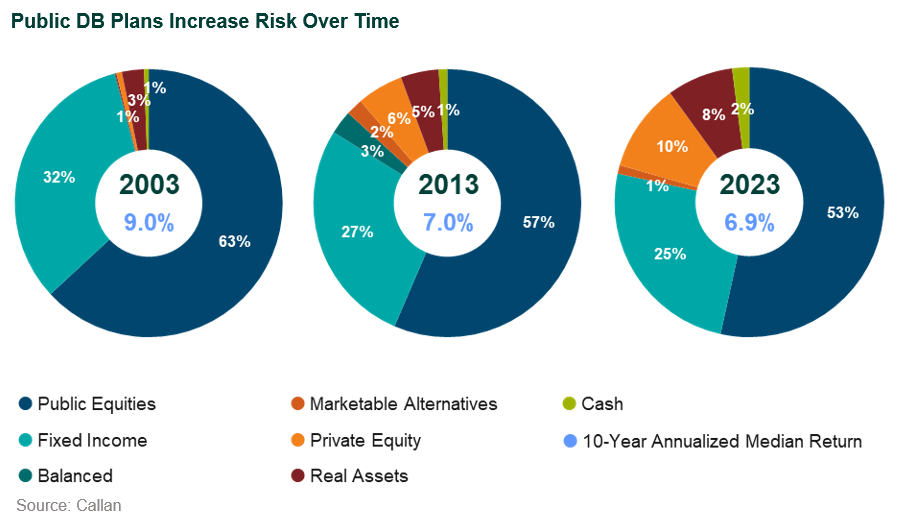
The second long-term trend is that public DB plans have increased risk in order to design an asset-allocation strategy with a rate of return that is more likely to meet their discount rates in the expected case. This trend is less straightforward, as the concept of risk has many definitions. The chart below demonstrates how asset allocations have changed over the last two decades. Note that the average allocation to fixed income has decreased from 32% in 2003 to 25% in 2023. However, public equity allocations have also decreased, which could be risk-reducing. These reductions in public fixed income and public equity have largely funded both real assets and private equity. This is where the different definitions of risk are important. The 2023 portfolios may not have higher volatility (or market risk), but they most certainly maintain higher liquidity risk than the portfolios of 2003.
It is now becoming safe to say that barring any unexpected catastrophe, the FOMC has moved past the era of a zero-bound Fed funds rate. After steep increases in the Fed funds rate in 2022 and resulting higher expected returns across most asset classes, many public plans now find that their expected return on their current asset-allocation mix exceeds that of the discount rate set by their actuary.
As a result of this changed environment, will these two trends now reverse? In other words, will public plans begin to raise their discount rates? Or will they shift back to a more conservative posture? Where might asset allocations trend going forward?
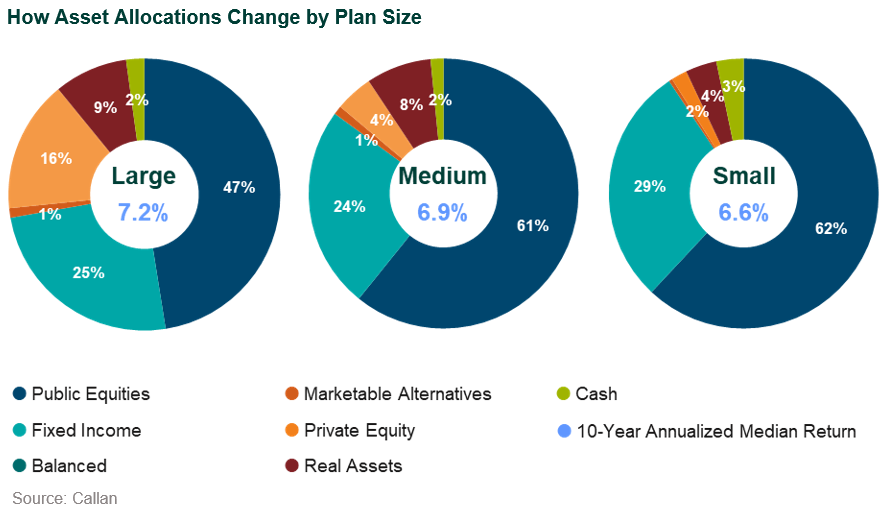
In order to better address these questions, we must first take a closer look to where changes have been made over the last 20 years. The chart below highlights the most recent asset allocations by plan size. Large plans, or those above $1 billion in assets, show the largest allocations to alternative asset classes—defined broadly as private equity, private credit, private real assets, and hedge funds. The current allocations of medium (between $100 million-$1 billion) and small (below $100 million in assets) plans show more modest allocations to alternative asset classes but meaningfully higher allocations to public equity. Plan size could matter in how asset allocation changes going forward.
Another key component affecting asset allocation of all sizes, both current and future, is the funded status of a plan. Regardless of size, underfunded plans may need a more aggressive asset-allocation posture to help generate a higher rate of return, ultimately serving to improve their funded ratio. As shown by this chart, even after a decade of above average U.S. equity returns, state and local DB plans of all sizes remain only around three-quarters funded.

Noting the need for higher returns to improve funded levels, it makes sense that asset-allocation mixes may remain aggressive for the foreseeable future. This means that any predictions of large scale “de-risking”—which is continuing to occur in corporate DB plans—is unlikely to be a key theme going forward for public DB plans. This also means that large plans may continue to test their individual bounds for illiquidity. Cash flows are a key determinant of how much illiquidity a plan can withstand. Net negative cash flows have averaged between 2%-3% over the last 20 years, and despite most plans becoming more mature, cash outflows may not dramatically increase as a greater percentage of plans are making their actuarially determined contributions. This suggests that on the aggregate level, public plans can afford to take on some liquidity risk.
What matters most, of course, is on the individual level. Plans with net negative outflows greater than 5% of assets should pay close attention to potential downside scenarios that could place greater strain on the liquid portions of the portfolio.
Medium-sized plans arguably exhibit the greatest opportunity for change in asset-allocation strategy. As alternative asset classes gain more acceptance and products evolve to allow greater access, medium-sized plans may ultimately move to invest like their large plan peers. As real assets have already gained acceptance from this cohort, private equity and private credit strategies are likely to benefit from medium-sized plans’ willingness to trade volatility risk for liquidity risk.
To summarize, there are two trends that have occurred over the past two decades: 1) lower discount rates; and 2) higher-risk portfolios. Public funds may have moved past the era of ultra-low interest rates—where will they go from here? Comparing the past with today and what could be in the future, we are confident that change remains a constant. Where and how those changes occur, we are less certain. However, it seems reasonable that plans will continue to maintain an aggressive risk posture and that the evolution toward more complex portfolios may not be fully halted solely by higher interest rates.
As the saying goes: “Making predictions are tough, especially when they are about the future.”
—Danish proverb
Disclosures
The Callan Institute (the “Institute”) is, and will be, the sole owner and copyright holder of all material prepared or developed by the Institute. No party has the right to reproduce, revise, resell, disseminate externally, disseminate to any affiliate firms, or post on internal websites any part of any material prepared or developed by the Institute, without the Institute’s permission. Institute clients only have the right to utilize such material internally in their business.