You are currently viewing this website using the Internet Explorer (IE) web browser. This website has limited functionality in IE, and you won’t be able to download research documents. For an optimal experience, please access this website using any other supported web browser.
Listen to This Blog Post
U.S. stocks continued their strong performance, although there were some subtle shifts under the hood. Utilities were the top performer in 3Q24, while Technology was among the worst. Small cap outpaced large cap, and value topped growth. But the Magnificent Seven powered on. Global equities also had a strong quarter, with emerging markets doing especially well. The Aggregate soared, after flat returns in 2Q24. Dollar weakness drove the Global Aggregate higher.
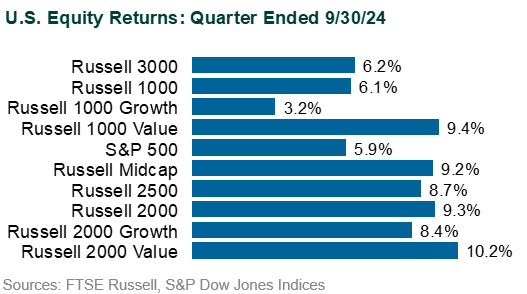
U.S. equities: U.S. stocks posted solid gains in 3Q, extending the strong performance for the year. The S&P 500 gained 5.9%, outperforming the tech-heavy Nasdaq Composite, which rose 2.1%. Year-to-date the S&P 500 (+22.1%) remains ahead of the Nasdaq (+20.0%). Within the S&P 500, Utilities (+19.4%) and Real Estate (+17.2%) led the sectors while Energy (-2.3%), Technology (+1.6%), and Communication Services (+1.7%) were the worst performers. Small cap stocks outperformed large cap stocks (Russell 2000: +9.3% vs. Russell 1000: +6.1%). Value beat growth (Russell 3000 Value: +9.5% vs. Russell 3000 Growth: +3.4%), but growth remained ahead year-to-date. The Magnificent Seven were up 35% year-to-date and represented 45% of the S&P 500’s return this year (top three were NVIDIA: +136%, Meta: +63%, and Amazon: +22%)
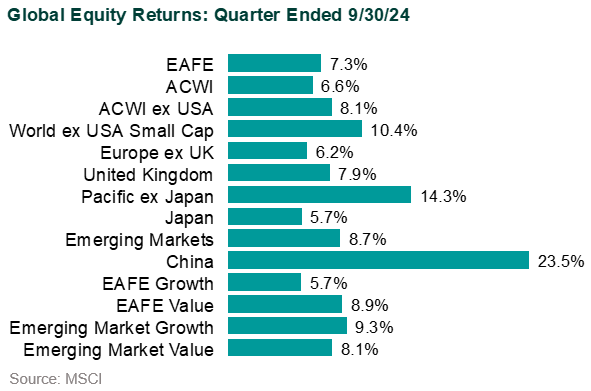
Global equities: Global ex-U.S. equities (MSCI ACWI ex USA: +8.1%) also finished the quarter strong, boosting returns year-to-date (+14.2%). Within developed markets, Value (MSCI World ex-USA Value: +9.7%) outperformed growth (MSCI World ex-USA Growth Index: +5.9%) by a wide margin. Real Estate (MSCI EAFE Real Estate: +17.4%) and Utilities (MSCI EAFE Utilities: +15.6%) were the strongest-performing developed market sectors. Japan (MSCI Japan: +5.7%) was up for the quarter, but stocks declined in September following the election of a new prime minister known for pushing fiscal discipline and being a China hawk.
Emerging markets (MSCI Emerging Markets: +8.7%) outperformed developed markets (MSCI EAFE: +7.3%). Asia was the strongest region (+9.5%) with Thailand (+28.9%), China (+23.5%), and Malaysia (+20.5%) leading the way. Europe declined in 2Q, led by Turkey (-12.6%). Consumer Discretionary (+23.3%) and Health Care (+19.7%) were the strongest-performing sectors for the quarter. Energy (-2.5%) declined as oil prices have sunk this year.
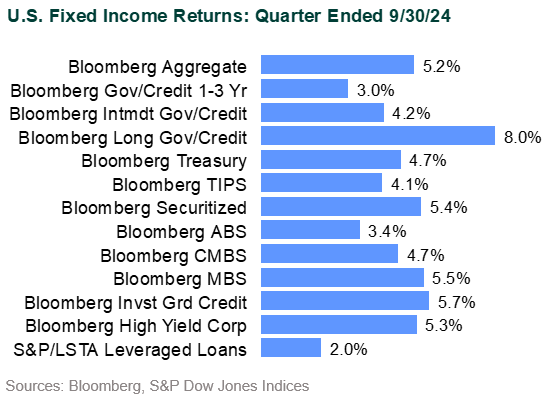
U.S. fixed income: The Bloomberg US Aggregate Bond Index soared 5.2% after producing flat returns in the previous quarter. Year-to-date, the Aggregate Index is up 4.9%. The 10-year Treasury yield sank 55 bps during the quarter, closing at 3.8% as markets priced in a higher probability of a deeper economic slowdown and more aggressive cuts. In early September, the 2-year and 10-year Treasury yields steepened and un-inverted for the first time since July 2022. All the Aggregate sectors outperformed Treasuries on a like-duration basis, led by agency mortgage-backed securities. Investment grade corporates (+5.8%) outperformed high yield (+5.3%) for the quarter. Spreads broadly remained flat over the quarter despite intra-quarter volatility and remained tight relative to historical averages. Both investment grade and high yield issuance was robust in 3Q.
Global fixed income: The Bloomberg Global Aggregate Index rose 7.0% (+4.2% hedged) propelled by dollar weakness as the U.S. Dollar Index declined. The story was similar within the emerging markets with the local currency JPM GBI-EM Global Diversified Index (+9.0%) outperforming the hard currency-denominated EMBI Global Diversified Index (+6.2%).
Municipal bonds: Municipal bonds posted gains in 3Q (Bloomberg Municipal Bond Index: +2.7%) with lower quality outperforming (Bloomberg Muni High Yield: +3.2%). The municipal bond yield curve steepened with the front end of the curve declining more than the long end. Ample supply for the quarter was met with strong demand.
Disclosures
The Callan Institute (the “Institute”) is, and will be, the sole owner and copyright holder of all material prepared or developed by the Institute. No party has the right to reproduce, revise, resell, disseminate externally, disseminate to any affiliate firms, or post on internal websites any part of any material prepared or developed by the Institute, without the Institute’s permission. Institute clients only have the right to utilize such material internally in their business.
For Investment Managers & Advisers
You are now leaving Callan LLC’s website and going to Callan Family Office’s website. Callan Family Office is not affiliated with Callan LLC. Callan LLC has licensed the Callan® trademark to Callan Family Office for use in providing investment advisory services to ultra-high net worth clients, family foundations, and endowments. Callan Family Office and Callan LLC are independent, unaffiliated investment advisory firms separately registered with the Securities and Exchange Commission under the Investment Advisers Act of 1940.
Callan LLC is not responsible for the services and content on Callan Family Office’s website. Inclusion of this link does not constitute or imply an endorsement, sponsorship, or recommendation by Callan LLC of their website, or its contents, and Callan LLC is not responsible or liable for your use of it. When visiting their website, you are subject to Callan Family Office’s terms of use and privacy policies.