Institutional investors have long been wary of sequence-of-returns risk, the possibility that the timing of bad short-term returns could harm outcomes even if the portfolio’s expected returns are achieved by the end of a long-term investment horizon.
This blog post, one in a series, is based on my recent paper on this risk, available at the link above. Other blog posts in the series will be available here.
Both the type of return used and the outcome an institutional investor cares about can vary widely by type of investor. An institutional investor can analyze Monte Carlo simulations of the appropriate types of long-term return and key outcomes to show whether possible long-term returns align with long-term outcomes.
Quantifying Sequence-of-Returns Risk
The sequence-of-returns risk can then be quantified using Spearman’s rank correlation, a close cousin of the “standard” Pearson correlation that is commonly used by institutional investors. A correlation of 1 indicates that there is no sequence-of-returns risk because long-term outcomes display total concordance with long-term returns.
This scenario, which is admittedly unrealistic for most types of investors, involves portfolios with no inflows or outflows. Lower correlation between long-term returns and long-term outcomes indicates greater sequence-of-returns risk.
Analyzing sequence-of-returns risk does not replace other tools used to evaluate asset-allocation risks but provides complementary analysis. And for some institutional investors, especially those with a high probability of depleting assets, sequence-of-returns risk may be outsized—and they ignore it at their peril and that of their beneficiaries.
How to Quantify Sequence-of-Returns Risk for a Public DB Plan
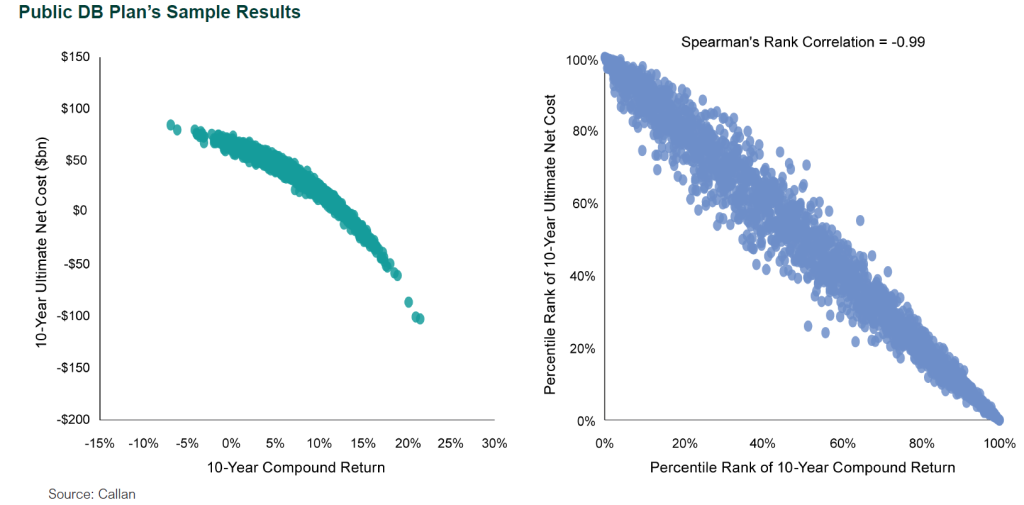
An example public DB plan client of Callan is shown in the chart below. The plan has a diversified strategic asset allocation consisting of public equities, fixed income, and alternative asset classes. The vertical axes indicate a metric important to many public DB plans called ultimate net cost. Slight variations on this metric exist, but a basic definition is the sum of 10-year cumulative employer contributions and the plan’s unfunded liability after 10 years. In other words, it is the combination of how much employers put into their pension plan over 10 years and how much is owed at the end of 10 years. Counterintuitively, ultimate net cost can turn negative if a plan generates sufficient surplus.

Lowering ultimate net cost may be a priority for some public plans. Improving long-term investment returns is strongly associated with lower ultimate net cost. But it is not a guarantee of a better outcome, comes with high levels of risk, is subject to forces outside a plan’s control—and can even increase sequence-of-returns risk. The chart illustrates the inverse relationship between long-term returns and ultimate net cost. The horizontal axis shows the 10-year compound return. After ranking returns and ultimate net cost, the absence of sequence-of-returns risk would be characterized by a straight line sloping down and to the right, as well as a Spearman’s rank correlation of exactly -1. That would be consistent with a plan that had no contributions, accruals, or benefit payments, a highly unrealistic hypothetical.
For this example public plan, Spearman’s rank correlation between 10-year compound return and 10-year ultimate net cost is -0.99. Depending upon their financial condition, public DB plans can mitigate sequence-of-returns risk through funding policy design, which can incorporate various asset smoothing, amortization, and other policies that dictate how contributions respond to short-term investment returns.

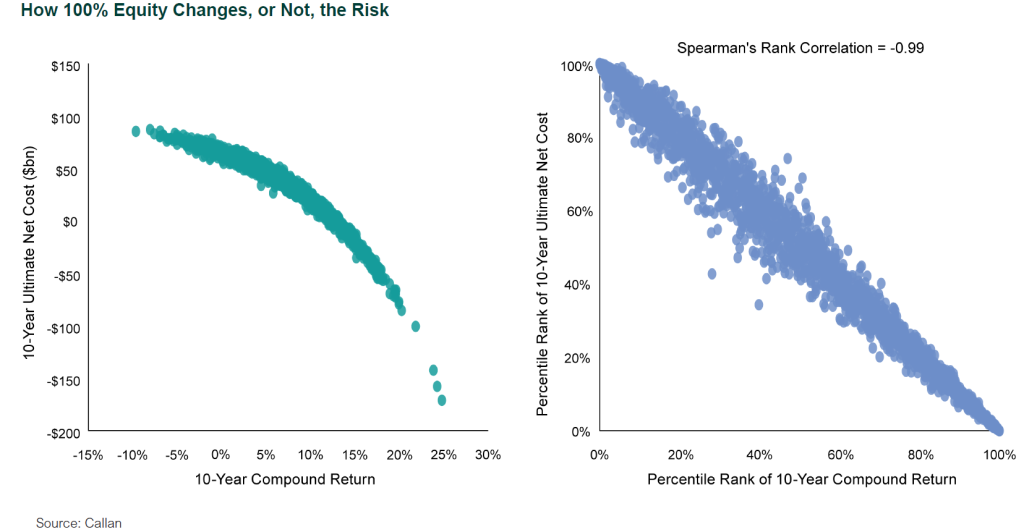
A hypothetical alternative investment policy reallocating to a 100% U.S. large cap equity portfolio is shown in the chart above. While such an undiversified portfolio is unlikely to be suitable for a public DB plan, it’s helpful to illustrate how sequence-of-returns risk might react in extreme scenarios. Although the higher standard deviation of outcomes is visible in the frequency of more extreme outcomes, Spearman’s rank correlation is similar. This large change to investment policy has little impact on sequence-of-returns risk for this example client because the strength of the plan’s financial condition and the nature of its funding policy allows long-term investment returns to readily translate into long-term outcomes regardless of whether those long-term outcomes are good or bad. Under the assumption that the plan sponsor successfully makes the contributions determined by the funding policy, sequence-of-returns risk is not meaningful for this example public plan. The flip side, of course, is that a plan without these advantages would face higher sequence-of-returns risk.
Disclosures
The Callan Institute (the “Institute”) is, and will be, the sole owner and copyright holder of all material prepared or developed by the Institute. No party has the right to reproduce, revise, resell, disseminate externally, disseminate to any affiliate firms, or post on internal websites any part of any material prepared or developed by the Institute, without the Institute’s permission. Institute clients only have the right to utilize such material internally in their business.

