“It is difficult to make predictions, especially about the future.”
— Danish Proverb
At the end of every year, Callan updates our long-term Capital Markets Assumptions. These projections for return, risk, and correlation are used to inform the strategic planning process for all of our clients. Their main purpose is to help clients design efficient portfolios. They are also used to form expectations for 10-year total portfolio returns to assist in a variety of planning exercises.
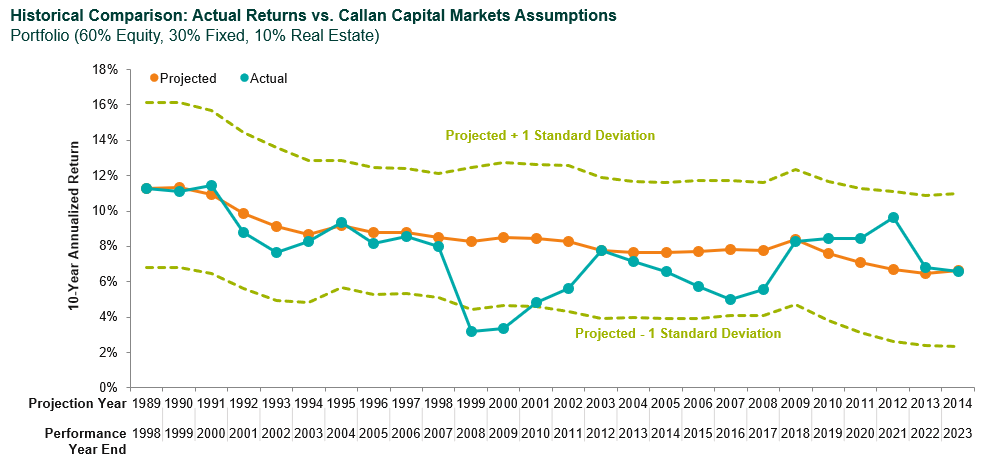
It is on this second score that we will focus today. The question that we often get from clients is, “How have you done in the past when predicting the future of the capital markets?” The short answer is, “not too badly.” The longer answer is shown in the chart below.

This graph goes back to our projections in 1989 and examines the record of Callan’s 10-year forecasted returns for a simple portfolio made up of 60% global equity, 30% U.S. fixed income, and 10% U.S. real estate. The bottom axis has two labels. The top numbers represent the year in which the forecast was made. The bottom numbers represent the ending date for the ensuing 10-year period.
The orange line represents the projected return for our forecasts for each 10-year period. The area between the two light green dashed lines represents a range of +/- one standard deviation around the projected return and is based on our projected standard deviation numbers for the sample portfolio at the time. Finally, the teal line represents the actual performance that was generated by the portfolio over the ensuing 10-year period.
This chart provides several valuable lessons that can benefit institutional investors as they assess how to understand and use capital markets assumptions. First of all, it shows that our projected returns for this portfolio have been on a steady decline since 1989. This is a reflection of a secular drop in inflation expectations, bond yields, and the equity risk premium.
Secondly, and more pertinent to this discussion, the chart illustrates that actual returns have generally been within one standard deviation of our projected returns over the subsequent period (though on the low side more often than the high side). The glaring exceptions are the 10-year periods ended in 2008 and 2009.
Unique to these two periods is the fact that they each contained not one but two major collapses in the equity market: the Dot-Com Bubble in 2001-02, and the Global Financial Crisis in 2008. Individually each of these collapses represented a 2-3 standard deviation event on the downside. When they are included in the same 10-year period, they completely overwhelm the projection numbers that we (and our clients) were working with 10 years earlier.
Actual performance in the most recent observation was right in line with our projection as equity markets rebounded in 2023 (S&P 500 up over 26%) after a steep decline in 2022. Bond returns also turned positive in 2023 (Bloomberg Aggregate up 5.5%) after a double-digit decline in the prior year.
To us the key takeaway from this exercise is that capital markets projections (ours and those of our peers) are generally good for describing a range of reasonable potential outcomes for a diversified portfolio. They are not, however, especially good at making point estimates of the return for any given 10-year period, especially when it includes a catastrophic financial crisis. This makes them effective tools for designing efficient portfolios and for simulating the risk of financial variables. When it comes to predicting the future, however, perhaps George Will summed it up best when he said, “The future has a way of arriving unannounced.”
Disclosures
The Callan Institute (the “Institute”) is, and will be, the sole owner and copyright holder of all material prepared or developed by the Institute. No party has the right to reproduce, revise, resell, disseminate externally, disseminate to any affiliate firms, or post on internal websites any part of any material prepared or developed by the Institute, without the Institute’s permission. Institute clients only have the right to utilize such material internally in their business.


